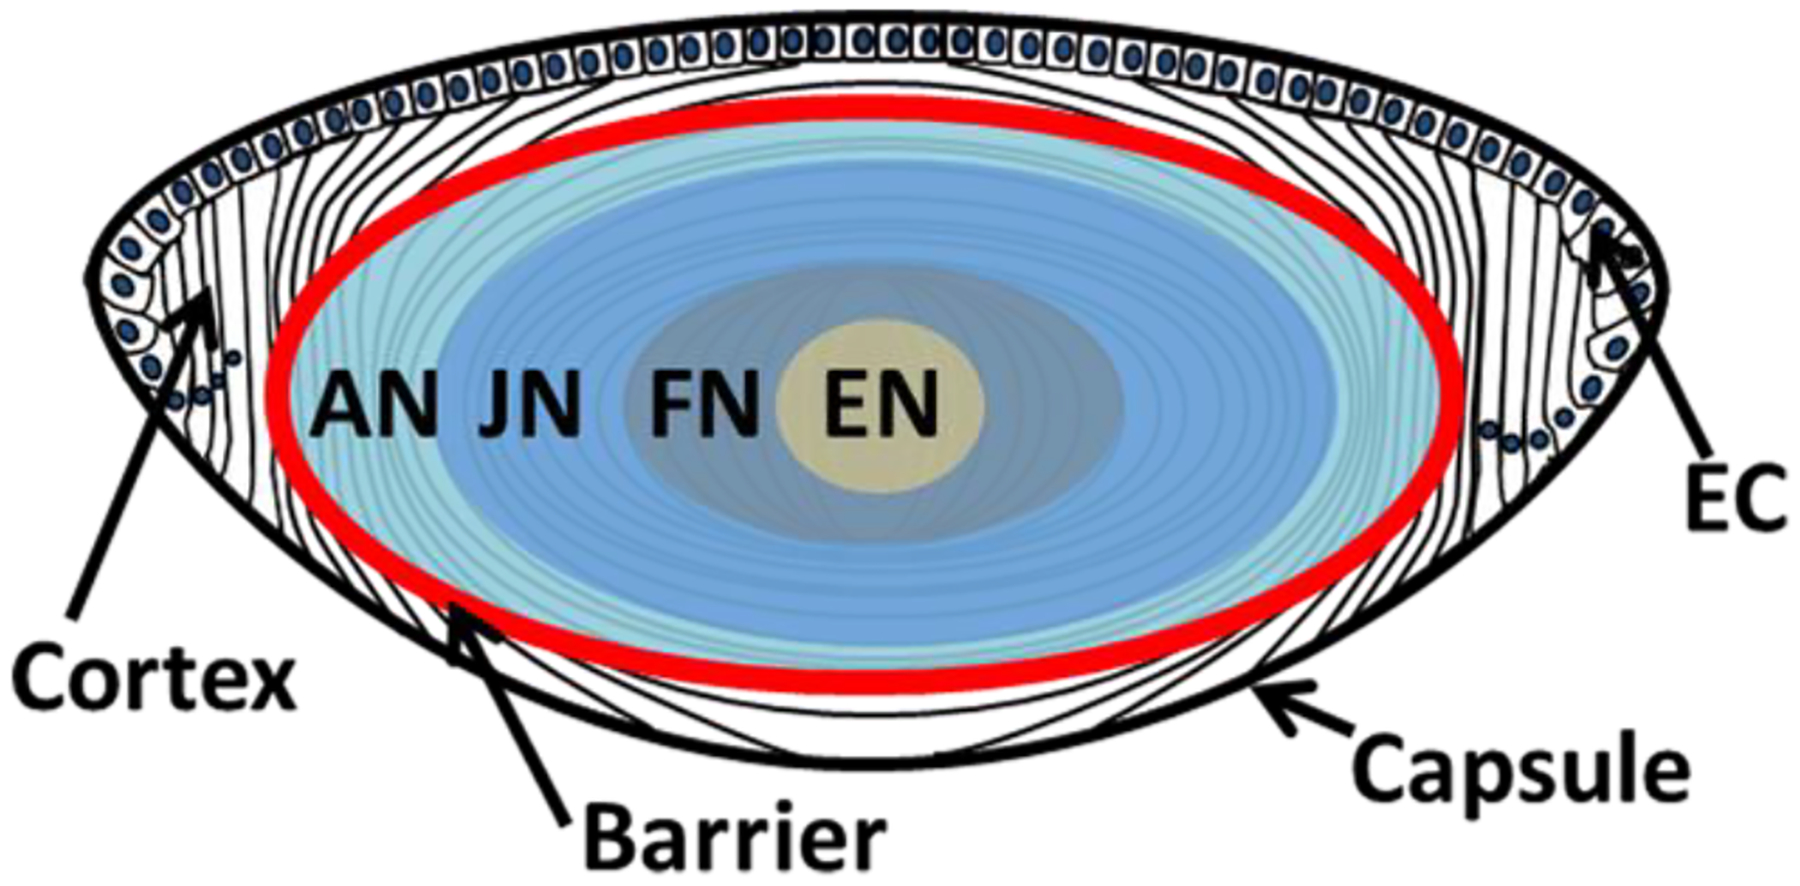
Figure 1. Diagram of human lens regions.

Schematic diagram of the human lens showing capsule, anterior layer of epithelial cells (EC), cortex, adult nucleus (AN), juvenile nucleus (JN), fetal nucleus (FN) and embryonic nucleus (EN). The red line indicates the barrier region where transport of water and glutathione are impeded in aged lenses.
