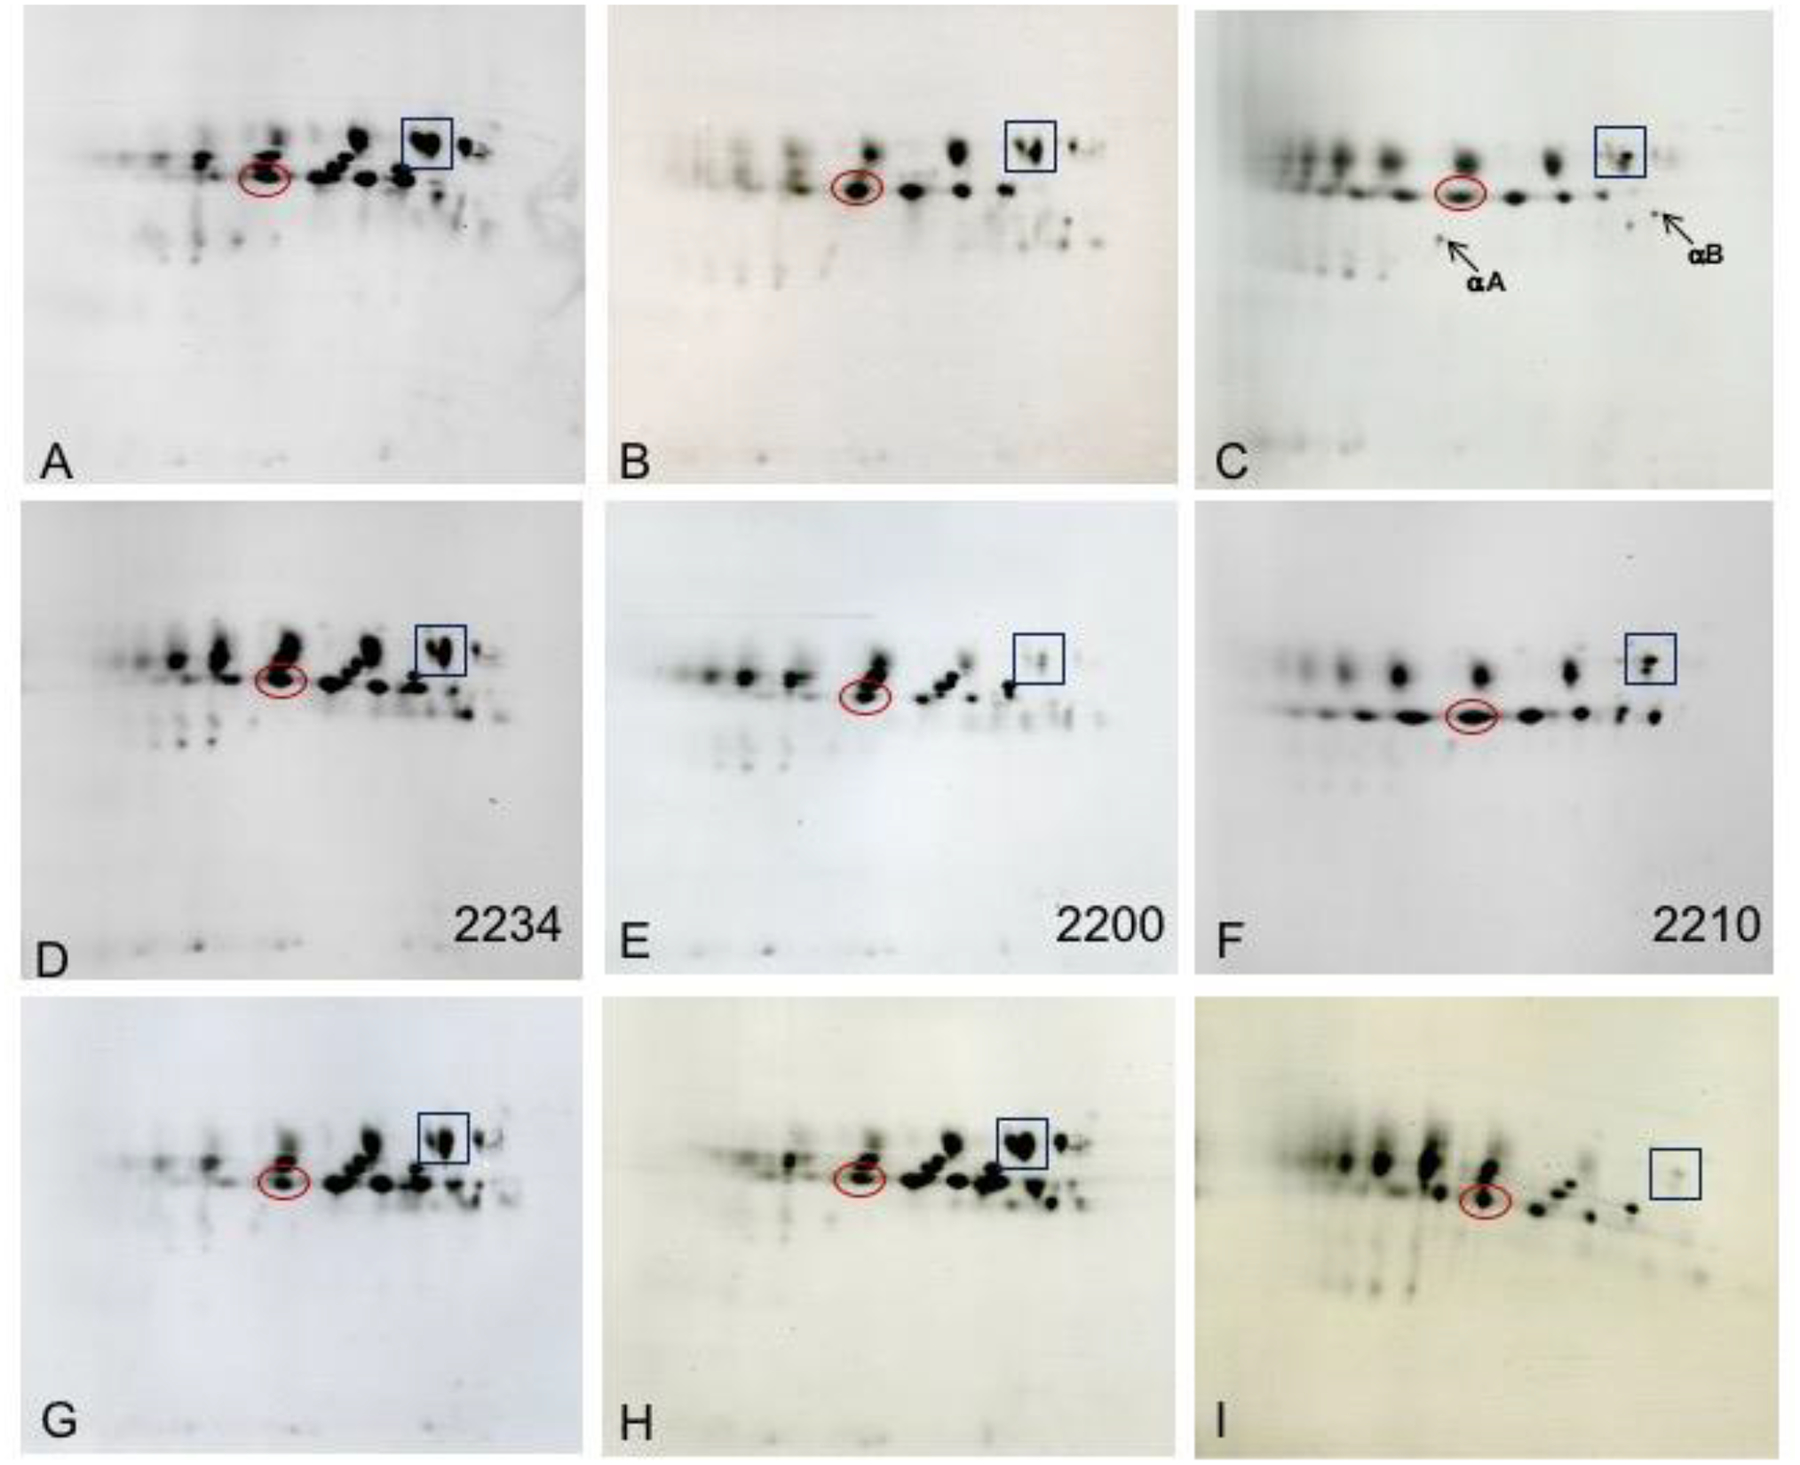
Figure 17. 2DE analysis of human cataractous lenses.

2DE patterns of human lens proteins observed from clear and cataractous lenses. Panel A: 57 y clear lens; Panel B: 64 y cataract; Panel C: 50 y cataract from India; Panel D: mixed cataract with LOCS 2234; Panel E: nuclear cataract with LOCS 2200; Panel F: nuclear cataract with LOCS 2210; Panel G: 35 y clear lens; Panel H: 44 y diabetic clear lens; Panel I: 81 y cataract. LOCS scores are for nuclear opalescence, nuclear color, cortical, PSC. On these gels the original form of αA-crystallin focuses at about pI 5.8, βB-crystallin focuses at about pI 6.8, and γS-crystallin focuses at about pI 6.4. The protein spots at the bottom of the gels migrate at Mr 10k. The boxes and circles in each image indicate the respective locations of 2 different crystallin species. The locations of the original forms of αA- and βB-crystallins are also indicated in Panel C. Proteins were solubilized in 8M urea/ 2% NP40/10 mM DTT, 2% ampholytes (Resolyte pH 3.5–10). (Garland and Datiles, unpublished).
