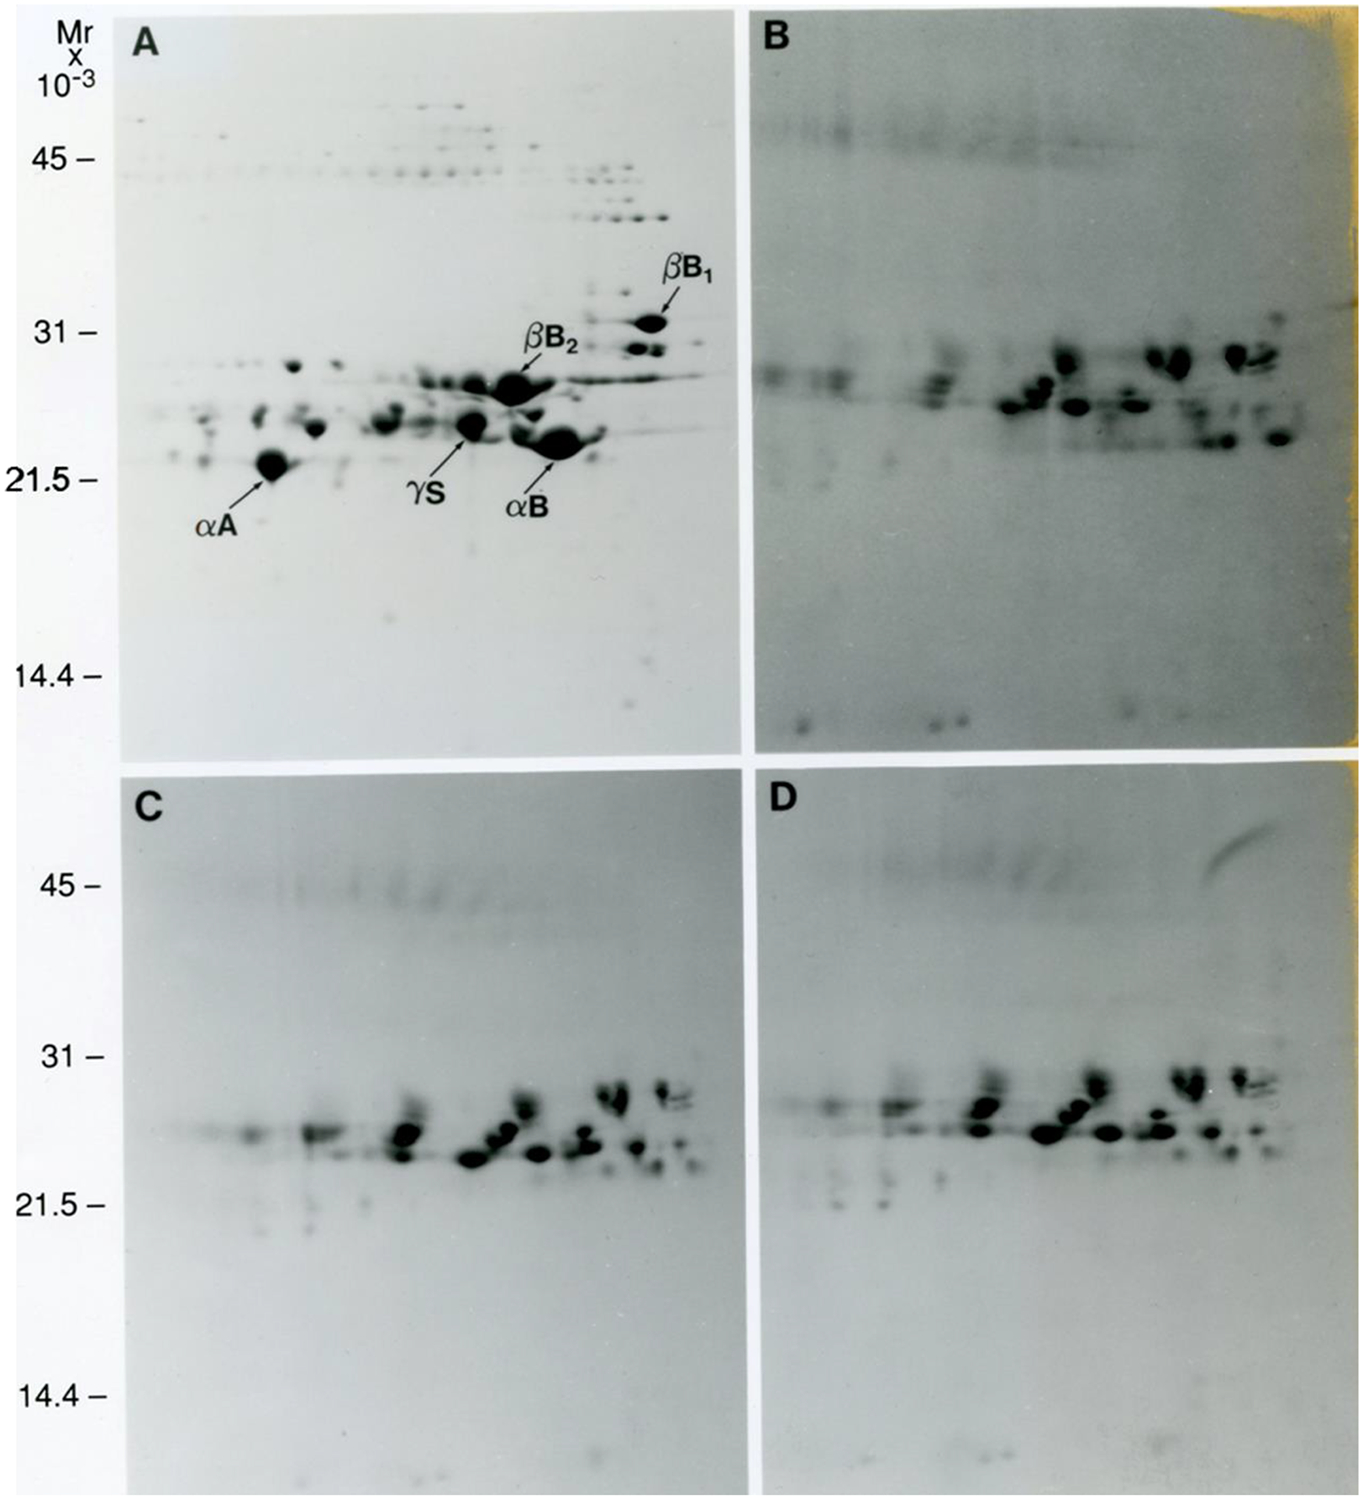
Figure 4. 2DE analysis of human lens regions.

Images of 2DE gels showing separation of proteins from a 42y human lens dissected into cortex (A), adult nucleus (B), fetal nucleus (C), and embryonic nucleus (D) regions. Figure from (Garland et al., 1996). Samples were solubilized in 9M urea, 2% NP40, 10mM DTT, 2% ampholytes (Resolyte pH 3.5–10). Proteins were separated based on isoelectric point using 18 cm non-linear, immobilized pH 3–10 gradients for 1st dimension isoelectric focusing (separation from acidic on the left to basic on the right) and based on size using SDS-PAGE in the second, vertical, dimension (18 × 25 cm gels). Each image represents total protein, water soluble and water insoluble, for all samples including the lens nucleus. Crystallin species migrated between pIs 8.6 and 5.
