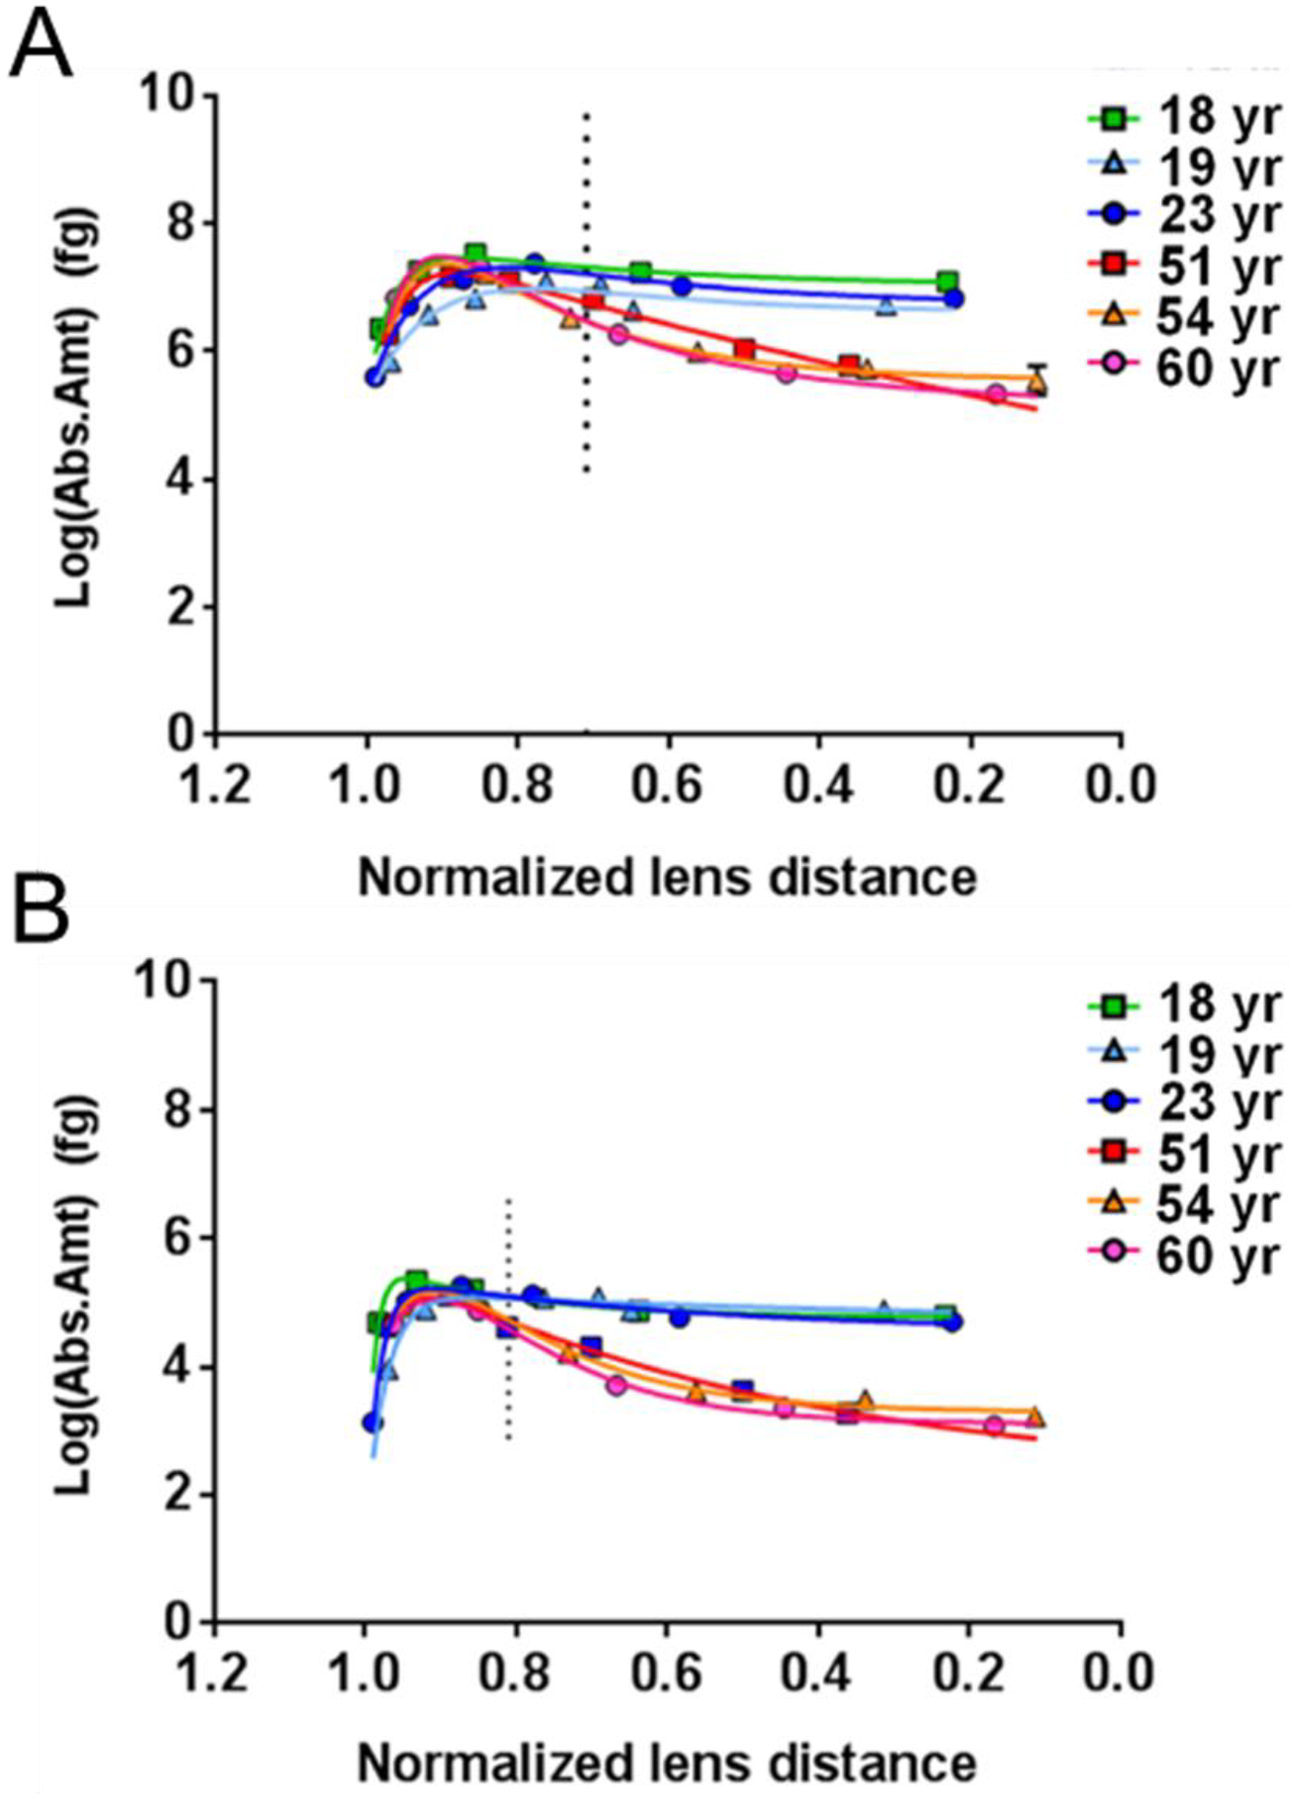
Figure 7. Spatial quantification of human lens AQP0 and MP20 phosphorylation.

Abundance of phosphorylated Ser235 of AQP0 (A) and phosphorylated Ser170 of MP20 (B) is shown as a function of lens age and normalized distance from the lens center. Lens surface (1.0) and lens center (0.0). The vertical dotted lines indicate the lens distance at which the phosphorylation levels are significantly different between young and old lenses. Figure from (Gutierrez et al., 2016).
