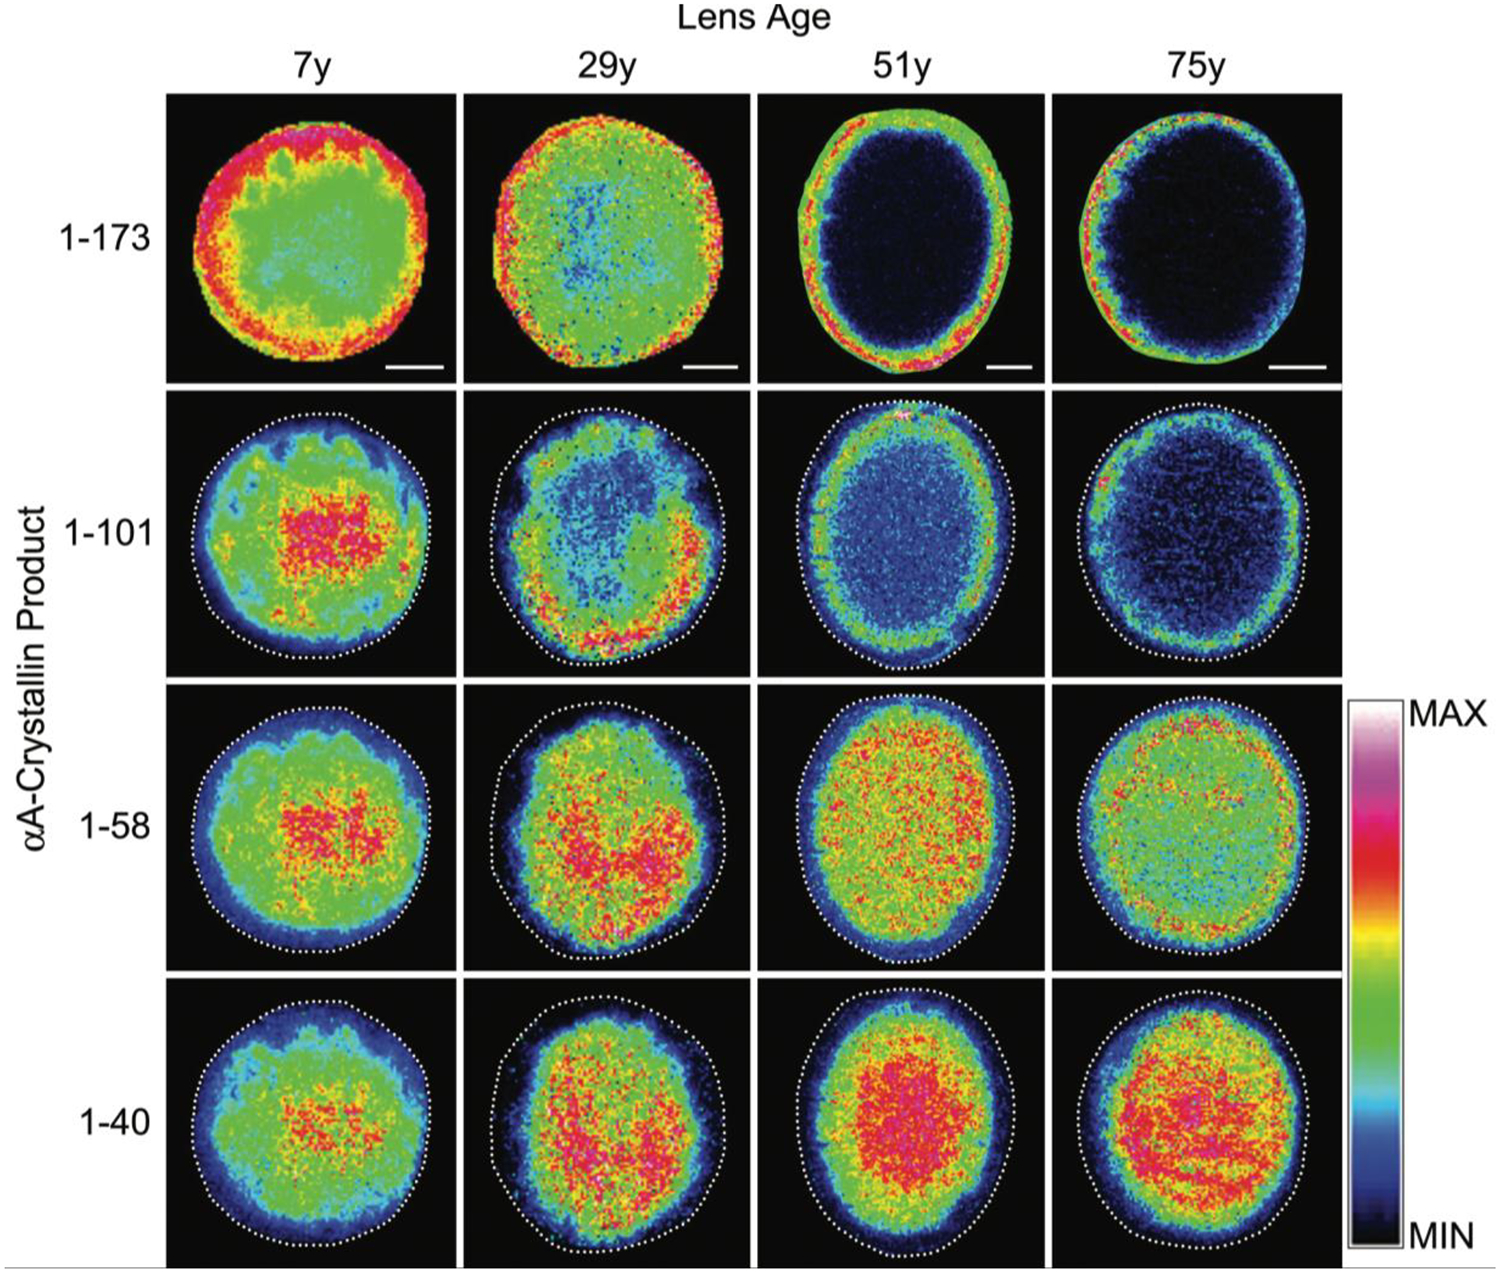
Figure 9. Spatial distribution of human αA-crystallin and its truncation products.

Imaging mass spectrometry of full length αA-crystallin (top row) and truncation products (rows 2–4) in human lenses as a function of age. Figure from (Grey and Schey, 2009).
