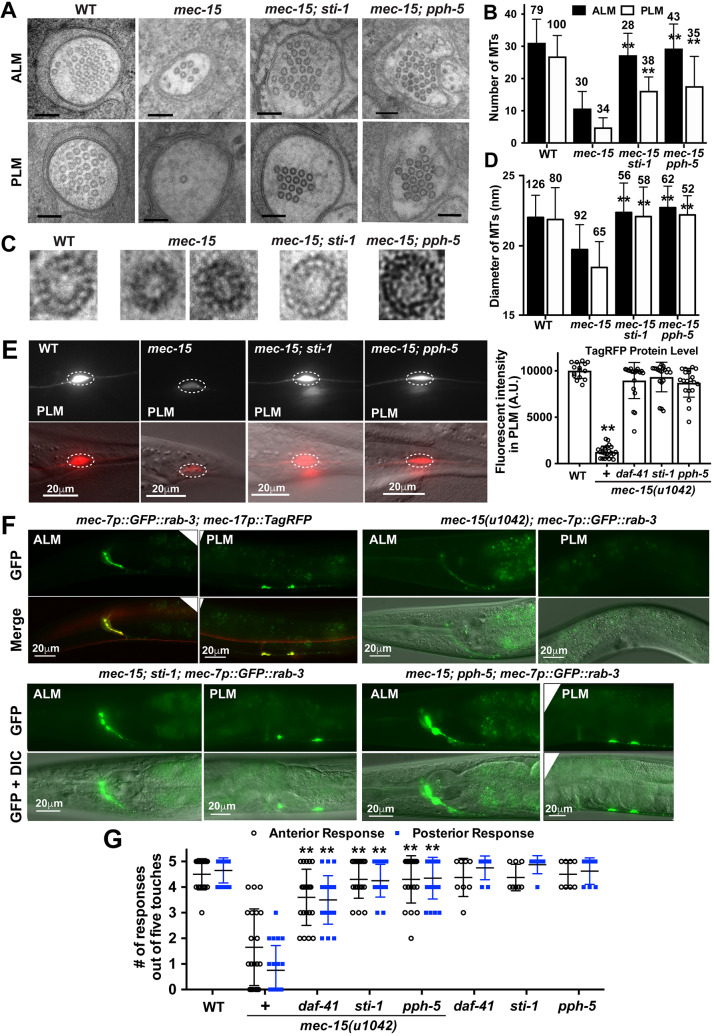
Fig. 4.
The loss of MTs and TRN developmental and functional defects in mec-15 mutants was rescued by mutations in Hsp90 co-chaperones. (A) Representative EM micrographs of cross-sections of ALM-AN and PLM-AN in wild-type, mec-15(u1042), mec-15; pph-5(ok3498) and mec-15; sti-1(ok3354) animals. Scale bars: 100 nm. (B) Average number of MTs in a cross-section of ALM-AN and PLM-AN in various strains. Numbers of sections analyzed for each strain are indicated above the bars. The sections are from at least ten animals. (C) Enlarged EM images of individual MTs with the protofilament visualized by tannic acid staining from the cross-sections of PLM-AN of the strains shown in A. (D) Average diameter of MTs in cross-sections from various strains. Number of MTs measured are indicated above the bars. In B and D, double asterisks indicate statistical significance (P<0.01) for the difference between mec-15 mutants and the double mutants. (E) Fluorescent intensity of TagRFP in PLM expressed from the uIs115[mec-17p::TagRFP] transgene in mec-15(u1042), mec-15; pph-5(ok3498), mec-15; sti-1(ok3354) and mec-15; daf-41(ok3052) mutants. Quantification is in arbitrary units (A.U.) for comparison. Representative images are shown with fluorescence only and fluorescence and DIC. (F) Localization of synaptic vesicles labeled by GFP::RAB-3 in TRNs of wild-type, mec-15, mec-15; sti-1 and mec-15; pph-5 animals. (G) The number of gentle touch responses from five gentle touch stimuli in the strains indicated at 20°C. Data are mean±s.d. **P<0.01 for the difference between mec-15 mutants and the double mutants.

