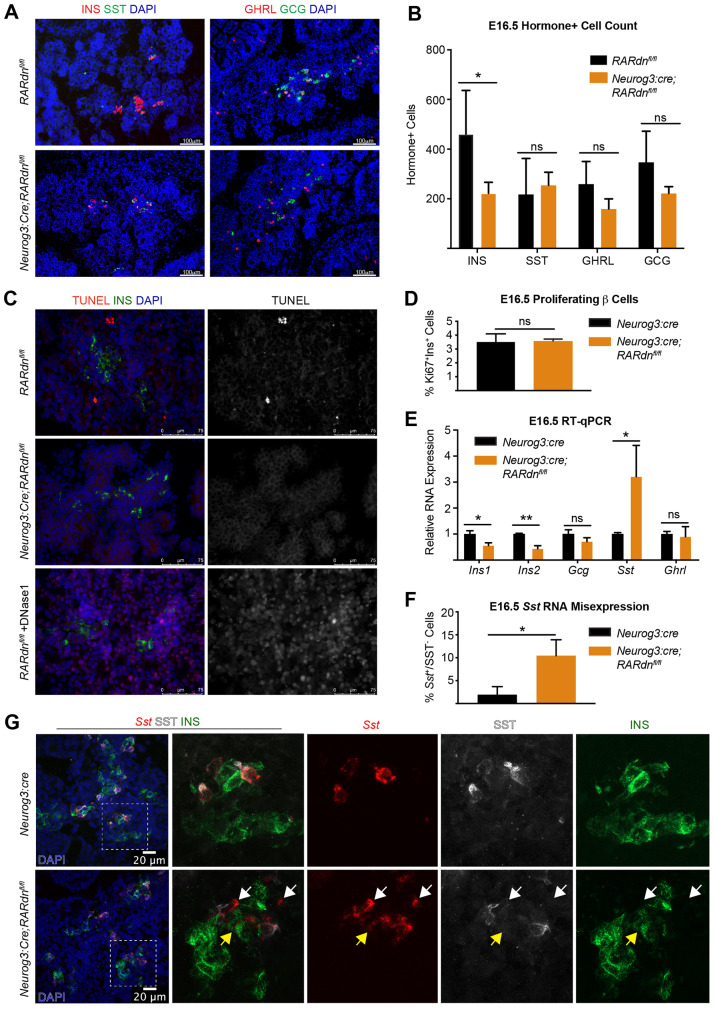
Fig. 1.
Endocrine-specific RA inhibition disrupts β cell development by E16.5 and increases Sst transcript expression. (A) Representative immunofluorescence images of E16.5 INS, SST, GCG and GHRL in RARdnflox/flox; Neurog3:cre mutants. (B) Quantification of A (n=4 control, n=5 mutant; statistical analysis was completed for multiple t-tests using the Holm–Sidak method to correct for multiple comparisons; *Padj<0.05 is significant). (C) TUNEL+INS staining at E16.5. DNase1(+) sample is a positive control (n=3). (D) β cell proliferation reported as a percentage of proliferating versus non-proliferating β cells (n=3, statistical analysis was performed using an unpaired parametric Student's t-test; P>0.05, not significant). (E) RT-qPCR gene expression analysis of E16.5 whole pancreata from RARdnflox/flox; Neurog3:cre mutants (n=3, statistical analysis was completed by the Benjamini, Krieger and Yekutieli two-stage step method to correct for multiple comparisons using Student's t-tests; *Q<0.05, **Q<0.005 are significant). (F) Quantification of the percentage of cells expressing Sst RNA but not SST protein (relative to all Sst RNA+ cells) in Neurog3:cre alone or RARdnflox/flox; Neurog3:cre mutants at E16.5 (n=3, statistical analysis was completed by an unpaired parametric Student's t-test; *P<0.05 is significant). Representative images can be seen in Fig. 1G. (G) Dual RNA-protein visualization using RNAscope and immunofluorescence analyses (n=3). White arrows indicate Sst RNA+ cells, SST protein–;INS protein– cells; yellow arrows indicate Sst RNA+ cells, SST protein–;INS protein+ cells. All n values represent biological replicates. Data are mean±s.d. ns, not significant.

