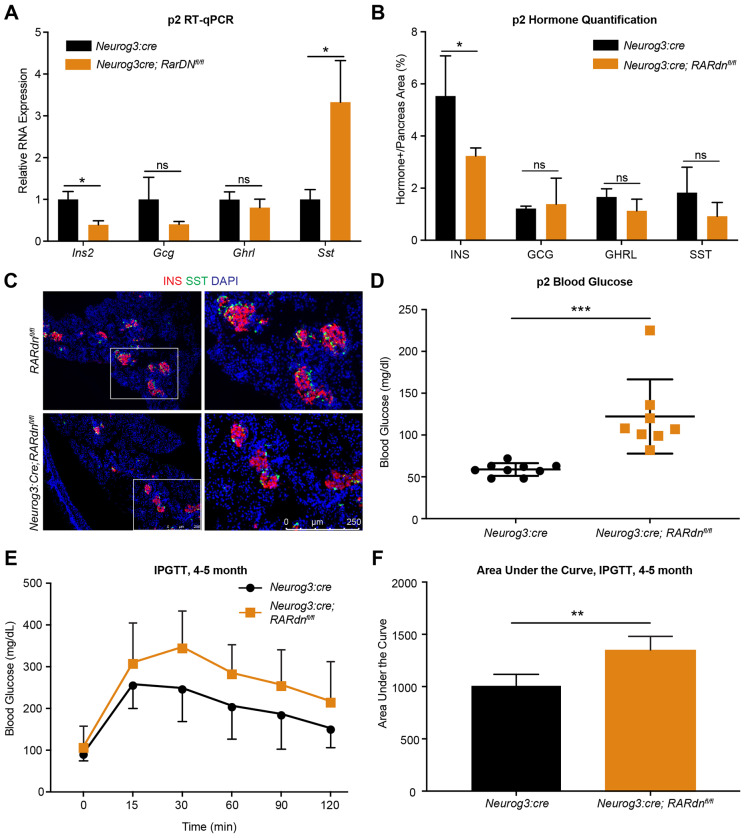
Fig. 2.
Postnatal blood glucose homeostasis is disrupted in RA mutants. (A) Gene expression analysis by RT-qPCR of P2 whole pancreata from RARdnflox/flox; Neurog3:cre mutants (n=3, statistical analysis was completed using the Benjamini, Krieger and Yekutieli two-stage step method to correct for multiple comparisons among multiple Student's t-tests; *Q<0.05 are significant). (B) Quantification of hormones in P2 pancreases (n=5, statistical analysis was completed for multiple Student's t-tests using the Holm–Sidak method to correct for multiple comparisons; *Padj<0.05 is significant). (C) Representative images of immunofluorescence at P2 for INS and SST. Scale bar applies to all panels. (D) Blood glucose at P2, reported in mg/dl. Statistical analysis was performed using an unpaired parametric Student's t-test method (***P<0.0005 is significant). (E) Glucose tolerance tests between 4 and 5 months in male RARdnfl/fl; Neurog3:cre mutants (n=4). (F) Area under the curve of the intraperitoneal glucose tolerance test (IPGTT) in E (statistical analysis was peformed using an unpaired parametric Student's t-test method; **P<0.005 is significant). All n values represent biological replicates. Data are mean±s.d.

