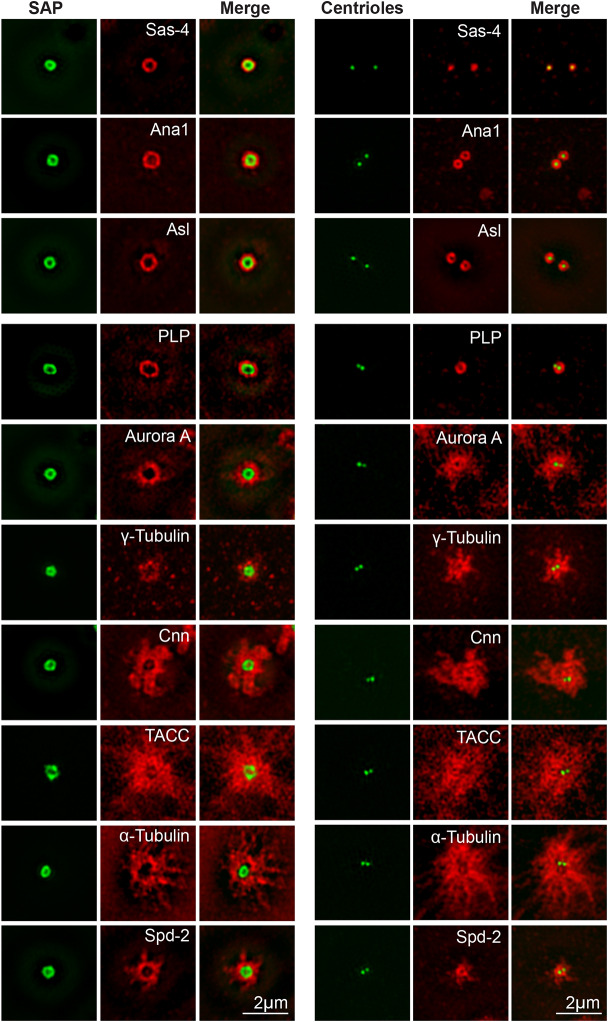
Fig. 2.
Centriole and centrosome protein organisation at SAPs and centrioles. 3D-SIM images illustrate the localisation of various centriole and centrosome proteins (red, as indicated) at either SAPs (left column) or bona fide centrioles (recognised with GFP-Sas-6, right column) (green). The SAP signal results from both GFP-Sas-6 and GFP-Ana2 fluorescence (green). The SAPs or centrioles/centrosomes were imaged in 4–5 eggs or embryos for each staining condition; representative images are shown. See Fig. S1D for quantification of the average distribution of these proteins relative to the surface of the SAP or centriole.

