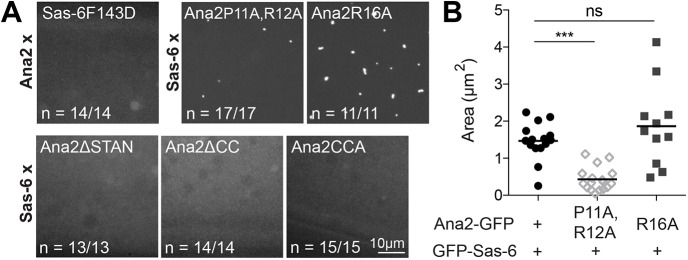
Fig. 4.
SAP assembly appears to require many of the interactions required for centriole assembly. (A) Confocal images of 0- to 3-h-old eggs expressing mutant forms of either GFP-Ana2 or GFP-Sas-6 (as indicated at the top of each image) with either WT GFP-Sas-6 or GFP-Ana2 (as indicated on the side of each image). The fraction of eggs exhibiting the phenotype shown is indicated. (B) SAP size in 0- to 3-h-old eggs of the indicated genotype. Each data point represents the average SAP size in an individual egg (N=1–106 SAPs per egg; n=11–17 eggs per genotype). All data were normally distributed according to the D'Agostino and Pearson or Shapiro–Wilk normality test. One-way ANOVA was used to assess statistical significance. ns, not significant; ***P<0.001.

