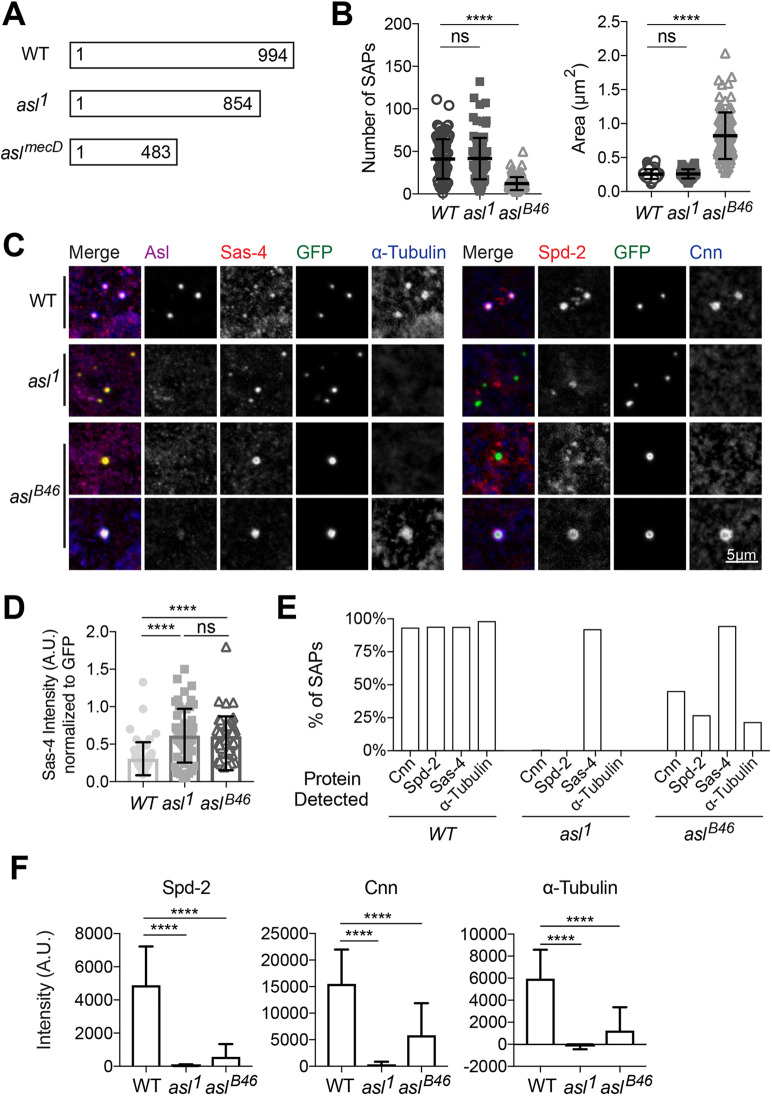
Fig. 7.
Role of Asl in mitotic PCM recruitment. (A) Scheme illustrates the different forms of Asl potentially produced in WT, asl1 and aslmecD tissues. Surprisingly, the asl1 allele appears to abolish PCM recruitment (Bonaccorsi et al., 1998; Varmark et al., 2007), whereas the aslmecD allele does not (Blachon et al., 2009; Galletta et al., 2016b). (B) Number (left) and size (right) of the SAPs formed in eggs laid by females of the indicated genotypes; note that we use either the asl1 allele or the apparently null aslB46 allele (Baumbach et al., 2015), rather than the aslmecD allele, for these experiments. Each data point represents the average SAP size in an individual egg (N=1–132 SAPs per egg; n=101–107 eggs per genotype). Error bars indicate s.d. The data were not all normally distributed so a Kruskal–Wallis test was used to assess statistical significance. (C) Confocal images of SAPs in 0- to 3-h-old eggs laid by females of various genetic backgrounds (as indicated, left). The eggs were stained for Asl (magenta), Sas-4 (red), GFP (SAPs, green) and α-Tubulin (blue) (left five panels), or Spd-2 (red), GFP (SAPs, green) and Cnn (blue) (right four panels). Note that in the SAPs formed in these eggs we often detected some staining in the Asl (far-red) channel. We believe this is probably bleed-through from the very intense Sas-4 (red) channel. (D) Sas-4 fluorescent signal intensity of SAPs (normalised to the GFP signal) in eggs laid by females of the indicated genotypes. Error bars indicate s.d. The data was not all normally distributed so a Kruskal–Wallis test was used to assess statistical significance. (E) Percentage of SAPs in eggs laid by females of the indicated genotypes that recruit detectable levels of Cnn, Spd-2, Sas-4 or α-Tubulin. Note that the SAPs formed in the aslB46 eggs were significantly larger than those formed in WT eggs (see B); this is in contrast to the situation when SAPs were assayed by injecting mRNA encoding Ana2-mNeongreen and mNeongreen-Sas-6 into either WT or aslB46 eggs (Fig. 5C). We speculate that this is because the SAPs formed in the transgenic eggs assayed here have reached a steady-state size, which may not to be the case for the SAPs formed in the mRNA injection assay. (F) Spd-2, Cnn and α-Tubulin fluorescent signal intensity of SAPs in eggs laid by females of the indicated genotypes. Error bars indicate s.d. ns, not significant; ****P<0.0001.

