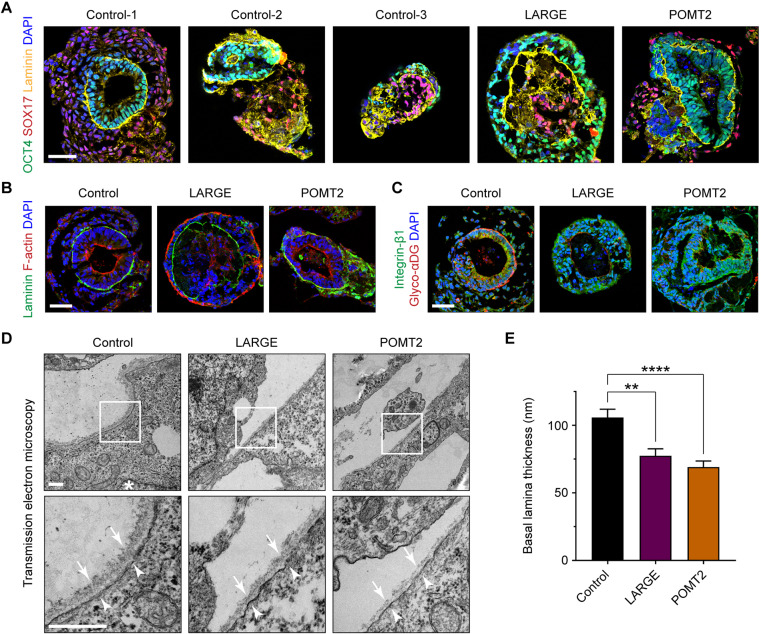
Fig. 4.
Ultrastructural ECM defects in α-dystroglycanopathy patient embryoid bodies. (A–C) Representative immunohistochemistry images of control and patient embryoid bodies at day 5 of differentiation. At least three independent differentiations were carried out on each of three control hiPSC lines and two hiPSC clones from the LARGE and POMT2 patients. Scale bars: 50 µm. (D) Transmission electron micrographs of embryoid body basal lamina. Asterisk, nucleus; arrows, basal lamina; arrowheads, plasma membrane. Scale bars: 500 nm. (E) Measurements of basal lamina thickness: control, 105.8±6.1 nm; LARGE, 77.5±5.1 nm; POMT2, 69.1±4.5 nm. Values shown as mean±s.e.m. Three control lines and two clones each from the LARGE and POMT2 patients were used. For each clone, micrographs from 2–3 independent differentiations were collected, and basal lamina was measured from n=35 (control), n=22 (LARGE) and n=23 (POMT2) separate regions throughout the cultures. Post hoc analysis with Kruskal–Wallis test and Dunn's correction for multiple comparisons: **P<0.01, ****P<0.0001.

