Fig. 1.
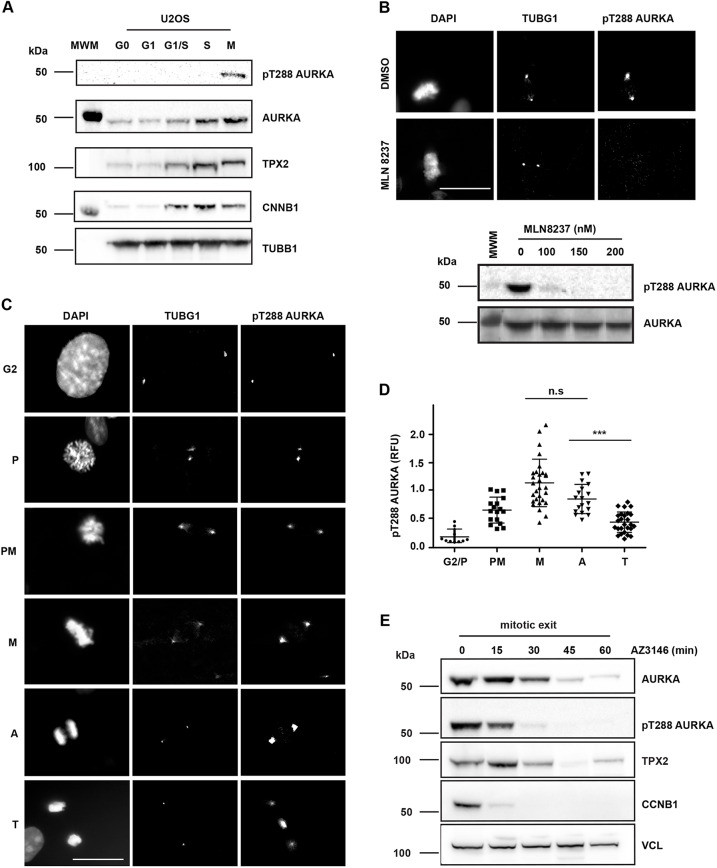
Inactivation of AURKA during mitotic exit begins at anaphase. (A) pT288 antibody detects active phosphorylated AURKA only in mitotic cells. U2OS cells were synchronized as described in the Materials and Methods and blotted for pT288, total AURKA and other mitotic markers (TPX2, CNNB1 and TUBB1). MWM indicates molecular weight marker lane. (B) pT288 signal is sensitive to the AURKA-specific inhibitor MLN8237, as shown by IF of mitotic cells from a MeOH-fixed unsynchronized population (upper panel) or by immunoblot of STLC-arrested mitotic cells treated for 3 h at the indicated doses (lower panel). AURKA-specific pT288 signal is restricted to centrosomes and spindle pole bodies (marked by γ-tubulin, TUBG1). DNA is shown by DAPI staining. DMSO indicates images of vehicle-treated control cells. MWM indicates molecular weight marker lane. See also Fig. S1. (C–E) Quantification of pT288-AURKA during mitotic exit. In C and D, unsynchronized cell populations were fixed and stained as in B. Cells were judged to be at different stages of mitosis according to DAPI staining (C) and scored for mean pT288 AURKA signal measured in a fixed region of interest centered on TUBG1 signal at centrosomes or spindle poles (D). Scatter plots show distribution and mean±s.d. of pooled data from two independent experiments. Data are normalized to the mean value at metaphase. The plot is representative of two biological replicates. G2 and prophase (P), n=10; prometaphase (PM), n=15; metaphase (M), n=30; anaphase (A), n=30 and telophase (T), n=26. M versus A, not significant (n.s.); A versus T, P<0.0001 (***); Student's t-test. RFU, relative fluorescence units. For the western blots shown in E, cells were synchronized in 5 μM STLC and released by checkpoint inhibition using 10 μM AZ3146, with extracts harvested at the times indicated. These were examined by immunoblotting for AURKA, pT288-AURKA and TPX2 levels. Disappearance of cyclin B1 (CCNB1) acts as marker for mitotic exit, and the level of vinculin (VCL) acts as loading control. Data shown in A is from a single experiment, data shown in B and E are representative of two experiments. Scale bars: 10 μm.

