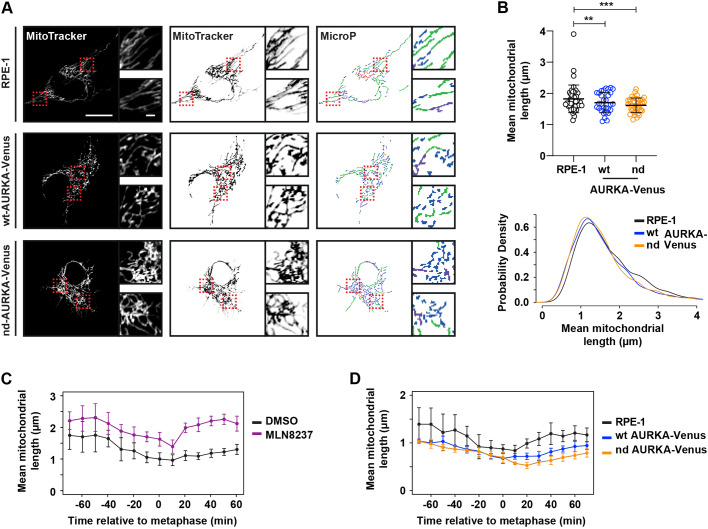
Fig. 6.
Undegraded AURKA at mitotic exit inhibits reassembly of the interphase mitochondrial network. (A,B) RPE-1, RPE-1 WT-AURKA–Venus and non-degradable version (nd, Δ32–66) cell lines were stained with MitoTracker™ and imaged 24 h after induction of AURKA transgene expression. Acquired images were analysed with MicroP (A) and subjected to mitochondria length quantifications (B). Dashed boxes indicate regions shown in magnified images. Inverted images (A, middle) and output of MicroP length analysis (A, right) are shown. Scatter plots show mean±s.d. for mean mitochondrial lengths from 30 mitochondria per cell in 18–24 cells per condition from two experimental replicates (upper panel). P-values are calculated from raw measurements using a Mann–Whitney test: **P<0.001; ***P<0.0001; n≥600. Lower panel shows kernel density plots of raw data. Scale bars: 10 μm in large panels, 1μm in inset panels. (C) RPE1 cells treated with either DMSO or 100 nM MLN8237 were stained with MitoTracker™ and filmed live as they progressed through mitosis. Mean±s.d. mitochondrial length over time is plotted for n≥6 cells per condition in two experimental replicates. (D) RPE-1 WT-AURKA–Venus and nd-AURKA–Venus cells were stained with MitoTracker™, then filmed and analysed as in C. Data are mean±s.d. of n≥5 cells.

