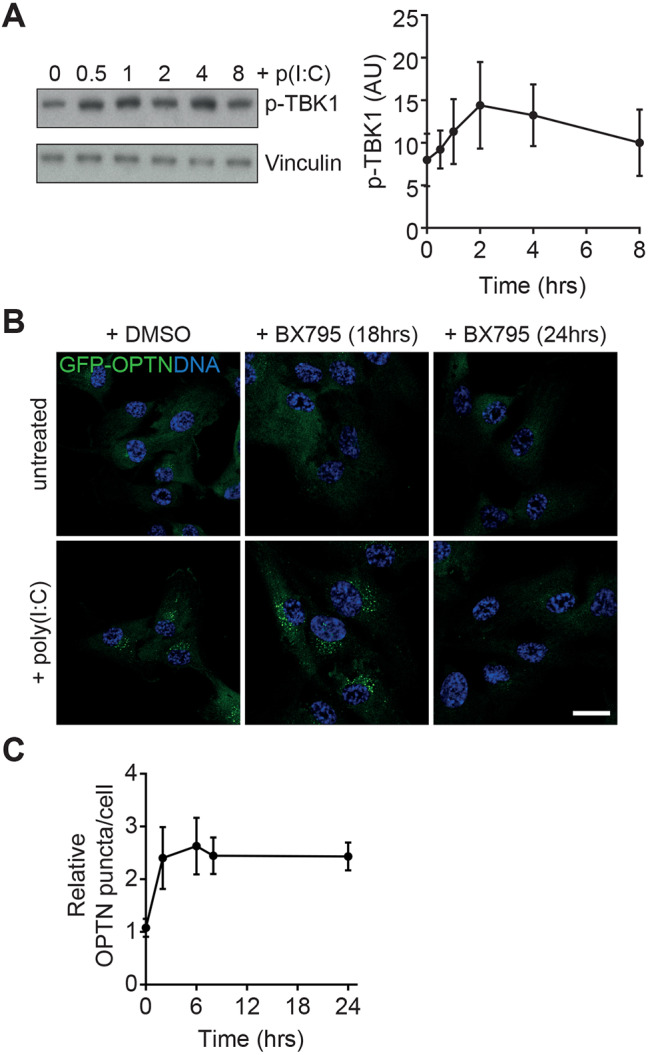
Fig. 3.

TBK1 inhibition perturbs foci formation. (A) Left, immunoblot analysis of lysates from RPE cells stimulated with poly(I:C) for the indicated times; the immunoblot shown in Fig. 1D was stripped and re-probed with p-TBK1 antibodies. The same vinculin blot was therefore also used as loading control (see Fig. 1D). Right, graph depicting gel band density analysis for p-TBK1. Points represent mean±s.e.m. of n=3 experiments. (B) Confocal microscopy images of RPE cells stably expressing GFP–OPTN (green) and treated with vehicle (top row) or poly(I:C) for 24 h (bottom row). Cells were simultaneously treated with DMSO or BX795 for 18 h (added after 6 h) or 24 h (added after 0 h). DNA was visualised with Hoechst (blue). Scale bar: 20 µm. (C) Relative foci counts per GFP–OPTN cell after treatment with poly(I:C) for 24 h combined with BX795 addition after the indicated times. Points represent mean±s.e.m. of n=3 independent experiments.
