Fig. 4.
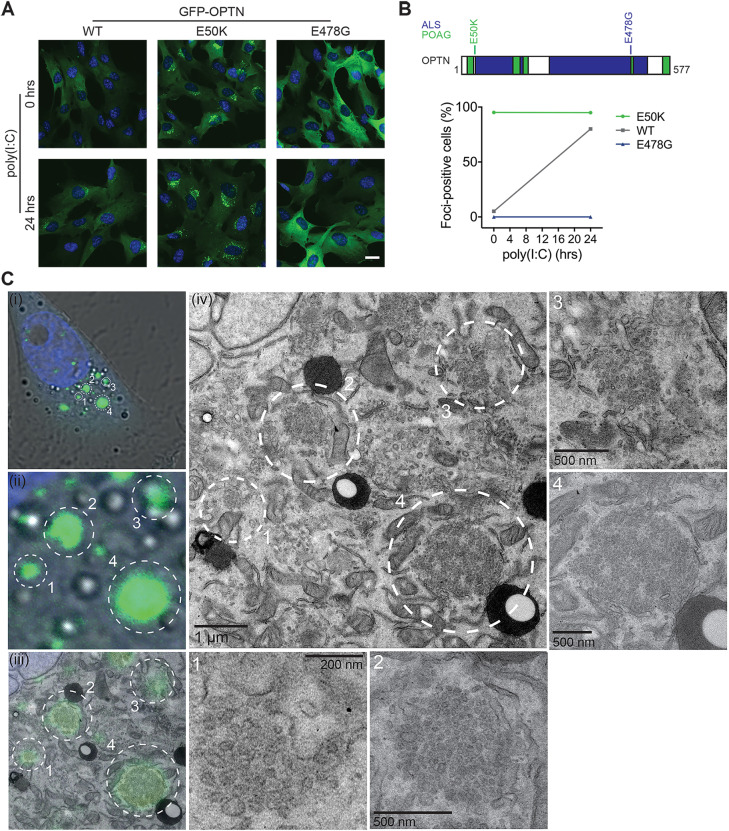
OPTN disease mutants promote aberrant foci formation. (A) Widefield microscopy images of RPE cells stably expressing GFP–OPTN wild-type (WT), E50K and E478G (green) and treated for 0 h or 24 h with poly(I:C). Cells were stained with Hoechst to label DNA (blue). Scale bar: 20 µm. (B) Top, schematic cartoon of OPTN domain structure with mutations highlighted. Bottom, graph depicting the mean±s.e.m. percentage of GFP–OPTN cells containing foci after 0 or 24 h of poly(I:C) treatment from n=3 independent experiments; >100 cells were manually counted per condition from ≥10 randomly selected fields of view. Error bars do not extend beyond the data points plotted due to the low values of s.e.m. for this experiment. (C) Correlative light electron microscopy (CLEM) micrographs of RPE cells stably expressing GFP–OPTN E50K. (i) Confocal microscopy image of a cell and (ii) magnification of four GFP-positive foci highlighted by the circled regions 1, 2, 3 and 4. (iii) Electron micrograph with confocal microscopy image of GFP-positive foci superimposed. (iv) Electron micrograph of foci-positive region. Four GFP-positive foci are highlighted by the circled regions 1, 2, 3 and 4, and are magnified in the corresponding panels 1–4.

