Fig. 7.
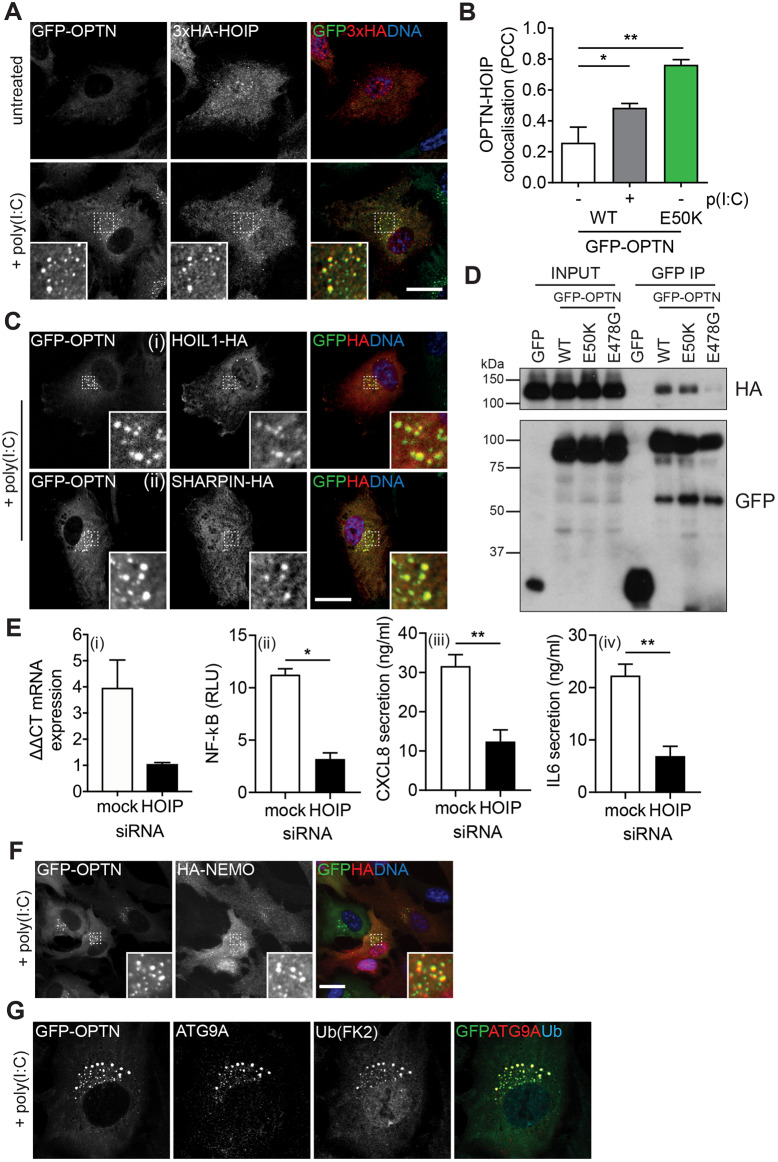
The LUBAC is recruited to foci. (A) Confocal microscopy images of RPE cells stably expressing GFP–OPTN (green) and 3×HA–HOIP and treated with poly(I:C) for 0 h (top) and 24 h (bottom). Cells were immunostained with an anti-HA antibody (red) and Hoechst to label DNA (blue). Insets show magnified views of regions indicated by dashed boxes. Scale bar: 20 µm. (B) Pearson's correlation coefficient (PCC) calculated for GFP–OPTN versus HOIP after treatment with poly(I:C) for 0 and 24 h. Bars represent the mean±s.e.m. of n=3 independent experiments. Cells were quantified from ≥5 randomly selected fields of view (1–2 cells/image). *P<0.05; **P<0.01 (one-way ANOVA and a Bonferroni post-hoc test). (C) Confocal microscopy images of RPE cells stably expressing GFP–OPTN (green) and HOIL1–HA (top) or SHARPIN–HA (bottom) and treated with poly(I:C) for 24 h. Cells were immunostained with an anti-HA antibody (red) and Hoechst to label DNA (blue). Insets show magnified views of regions indicated by dashed boxes. Scale bar: 20 µm. (D) Immunoblot of GFP immunoprecipitations (IP) from HEK293T transiently transfected with GFP, GFP–OPTN wild-type (WT), E50K and E478G probed with GFP and HA antibodies. Input, 2%. (E) Graphs of HOIP mRNA expression (i), NF-κB luciferase reporter activity (ii) and CXCL8 (iii) and IL6 secretion (iv) in RPE cells transfected with mock or HOIP siRNA and treated with poly(I:C) for 24 h. Bars depict mean±s.e.m. of n=3 independent experiments. *P<0.05; **P<0.01 (two-sample t-test). RLU, relative light units. (F) Confocal microscopy images of RPE cells stably expressing GFP–OPTN (green) and HA–NEMO. Cells were treated with poly(I:C) for 24 h and immunostained with an anti-HA antibody (red) and Hoechst to label DNA (blue). Insets show magnified views of regions indicated by dashed boxes. Scale bar: 20 µm. (G) Confocal microscopy images of RPE cells stably expressing GFP–OPTN (green) and treated with poly(I:C) for 24 h. Cells were immunostained with anti-ATG9A (red) and anti-ubiquitin (clone FK2; blue) antibodies. Scale bar: 20 µm.

