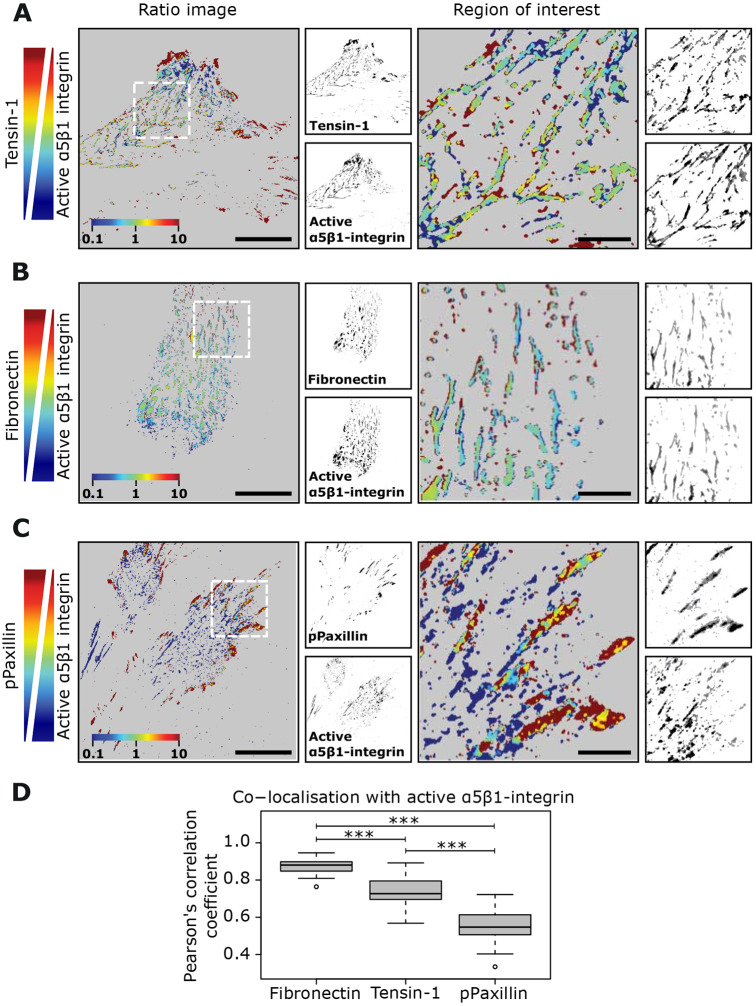
Fig. 3.
Active α5β1 integrin as a fibrillar adhesion marker. (A–D) TIF cells were plated on fibronectin-coated glass-bottom dishes overnight and stained for active α5β1-integrin and the indicated adhesion markers. Representative images and ratiometric analyses of colocalization between active α5β1-integrin (SNAKA51 antibody) and tensin-1 (A), active α5β1-integrin and fibronectin (B) and active α5β1-integrin and phosphorylated paxillin (pPaxillin) (C) and quantification of colocalization (Pearson's coefficient) are shown (D) (fibronectin n=28, tensin-1 n=21, pPaxillin n=24 cells). ***P<0.001 (one-way ANOVA and Tukey's honestly significant difference). Scale bars: 20 μm (main images; ROIs are 20 μm×20 μm). To obtain the Pearson's coefficient between each pair of images, the Fiji plugin JACoP was used. The Tukey box plots display the median and the interquartile range (IQR; 25th–75th percentile). Whiskers extend to ±1.5× IQR and circles represent outliers.

