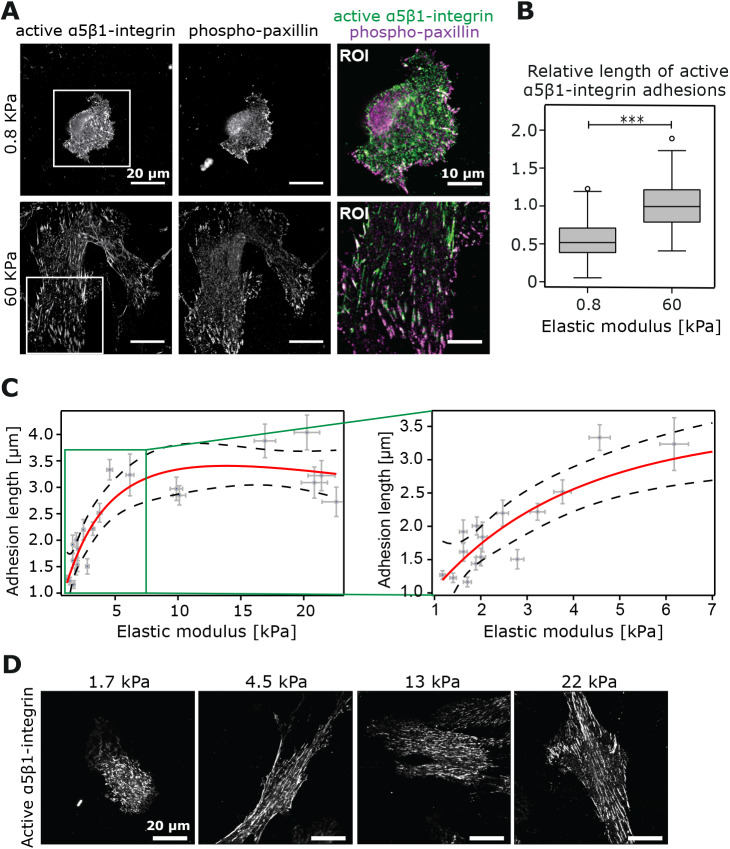
Fig. 4.
Active α5β1 integrin adhesions respond to changes in stiffness. (A) Representative images of TIFs plated on uniform stiffness hydrogels (0.8 kPa or 60 kPa) and stained for active α5β1-integrin and phospho-paxillin. Scale bars: 20 µm. (B) Tukey box plot of α5β1-integrin adhesion length (µm) from A [n=2 independent experiments, 9 cells (0.8 kPa) and 10 cells (60 kPa) analysed per experiment; 199 adhesions (0.8 kPa) and 211 adhesions (60 kPa)]. ***P<0.001. (C) Correlation analysis between substrate elastic modulus (kPa) and α5β1-integrin adhesion length (µm) in TIFs plated on a stiffness gradient hydrogel (0.5 kPa to 22 kPa) (n=1 independent experiment, 22 cells, >20 adhesions per cell). Error bars on the y-axis correspond to the s.d. on the adhesion length while error bars on the x-axis display error (95% c.i.) from the calibration curve used to convert from bead density into stiffness. (D) Representative images of TIFs stained for active α5β1-integrin from C across the stiffness gradient. Scale bars: 20 µm.

