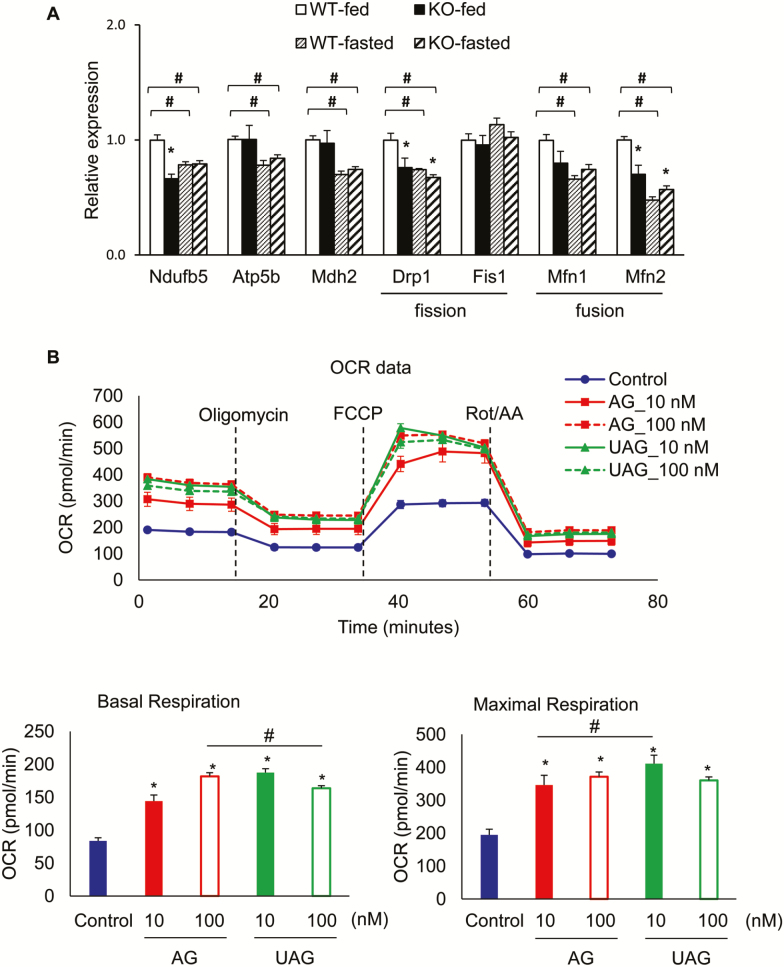
Figure 3.
Mitochondrial function in ghrelin-null mice, and acylated ghrelin (AG) and unacylated ghrelin (UAG) treatments on myocyte mitochondrial respiratory function. (A) Mitochondrial gene expression changes under fed and fasting condition. Data are presented as mean ± SEM, n = 4–5 per group. The symbol * denotes significant difference to wild-type (WT) mice at either fed or fasting state, and # denotes significant difference to WT-fed state (p < .05 analysis of variance [ANOVA]/Tukey Correction). (B) Baseline mitochondrial oxygen consumption rate (OCR), fraction of OCR used for ATP synthesis (determined by mitochondrial OCR after Oligomycin), and respiratory capacity (determined by mitochondrial OCR after addition of the uncoupler carbonyl cyanide-4-(trifluoromethoxy)phenylhydrazone [FCCP]; n = 6). Data are presented as mean ± SEM. *p < .05 versus control, and # denotes significant difference between doses, ANOVA/Tukey Correction.

