Figure 5.
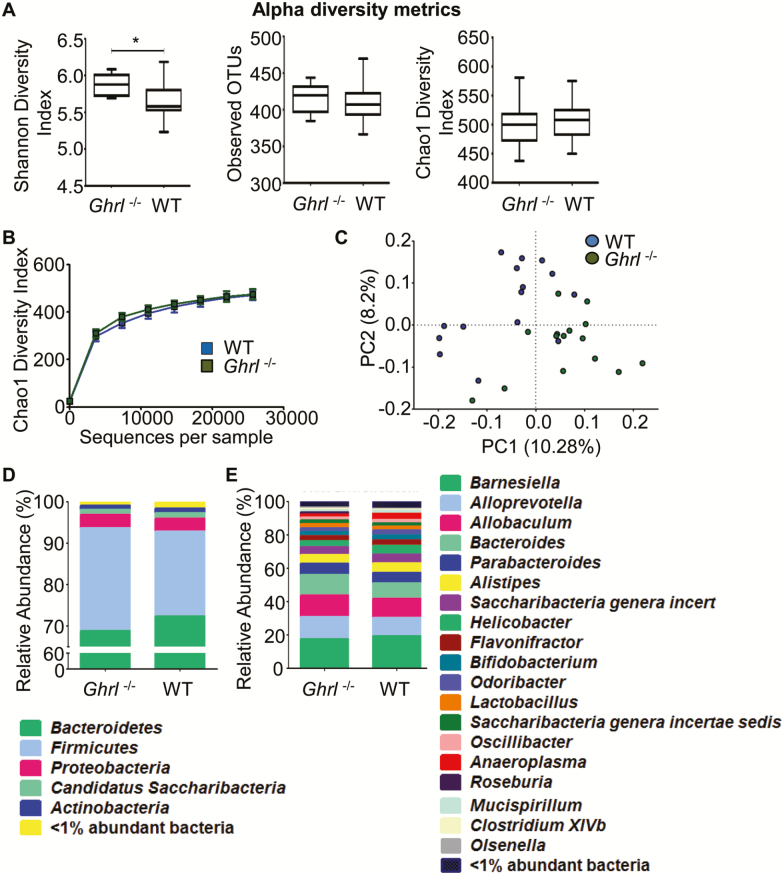
Deletion of ghrelin altered gut microbiota at young age. (A) Comparison of alpha diversity metrics for the fecal microbiome of wild-type (WT) and Ghrl–/– mice. Shannon diversity index (left panel) reveals a significant variation of microbiota richness and evenness between the intestinal microbiome compositions of the Ghrl–/– mice versus WT mice (p = .003). No significant differences (p = .533) were observed in taxonomic richness across the groups (middle panel) or in the Chao1 diversity index (right panel; p = .756). The Chao1 diversity index is another richness estimator that predicts the number of taxa by extrapolating the number of rare organisms. (B) Graphical presentation of the Chao1 diversity index. No significant differences were found. (C) Beta diversity comparison for the fecal microbiome of WT and Ghrl–/– mice. Principal coordinate analysis of mean beta diversity distances (unweighted UniFrac) between all samples. Axes represent two synthetic variables explaining the greatest proportion of variation in the samples. (D–E) Taxonomic composition of the fecal microbiome of WT and Ghrl–/– mice. Total operational taxonomic unit OTU relative abundances of the two mouse groups is represented at the phylum level (D) and the genus level (E). Data are presented as mean ± SEM. *p < .05 versus WT mice, Student’s unpaired t test.

