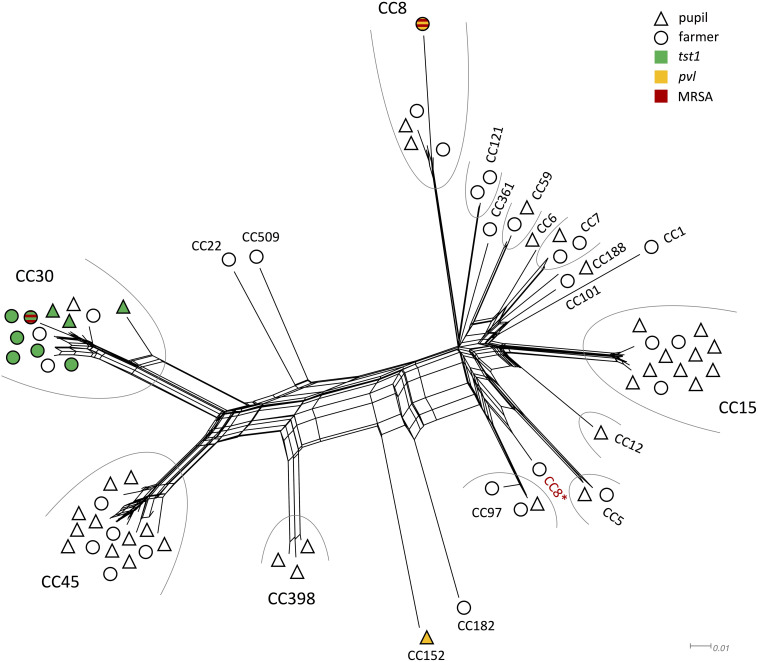
FIGURE 1.
Splitstree showing the similarity of genomic profiles determined by microarray. Clonal complexes are grouped by an arc, if there were at least two isolates of the same CC. Symbol shape denominates whether the isolate originated from a farmer (O) or pupil (Δ). The fill color indicates presence of tst1 (green), pvl (yellow), or MRSA (red). ∗CC8 strain that grouped differently than other CC8 strains.

