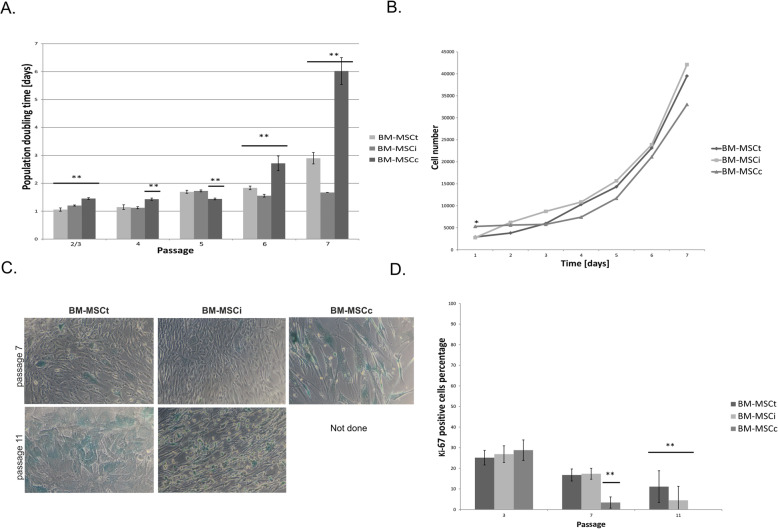
Fig. 4.
Analysis of BM-MSC cell growth. a Population doubling time (PDT, measured in days) determined at each culture of BM-MSCi, BM-MSCt, and BM-MSCc from the 1st to passage 7. b The comparison of the growth curves of different BM-MSCs (passage 2/3) calculated based on metabolic activity determined by measuring absorbance at 450 nm wavelength. c The representative images of senescence β-galactosidase-positive cells in BM-MSCi, BM-MSCt, and BM-MSCc taken from pictures of five independent experiments. Light blue staining can be observed from passage 7 and gradually increases at passage 11. d. Graph representing the percentage of proliferating cells stained with Ki67 antibody. All data reflect mean ± SD from ≥ 5 independent experiments; **p < 0.01

