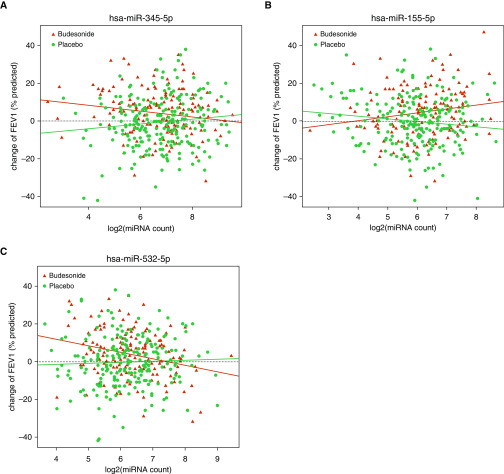
Figure 1.
Scatter plots of (A) hsa-miR-345-5p, (B) hsa-miR-155-5p, and (C) hsa-miR-532-5p in interaction analysis. Red points denote the subjects in the inhaled corticosteroid treatment group and green points denote the subjects in the placebo group. The red line represents the regression line of the inhaled corticosteroid treatment group and the green line represents the regression line of the placebo group. miRNA = microRNA.

