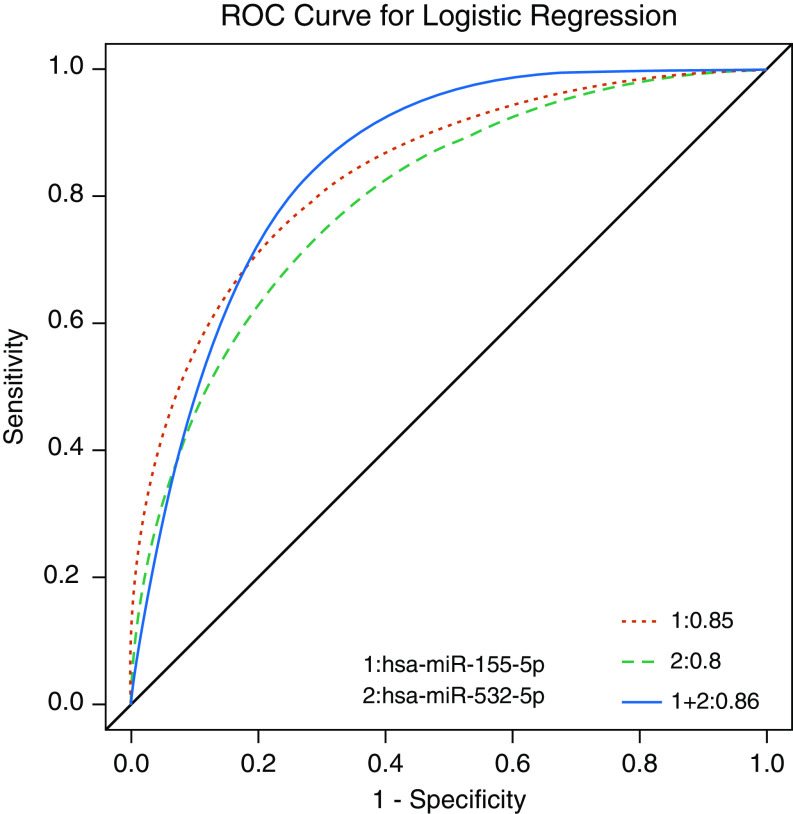
Figure 3.
Prediction of hsa-miR-155-5p and hsa-miR-532-5p in logistic regression model. The red dotted curve denotes the performance of hsa-miR-155-5p and the green dashed curve denotes the performance of hsa-miR-532-5p. The blue solid curve represents the effect of combined hsa-miR-155-5p and hsa-miR-532-5p. miR = microRNA; ROC = receiver operating characteristic.

