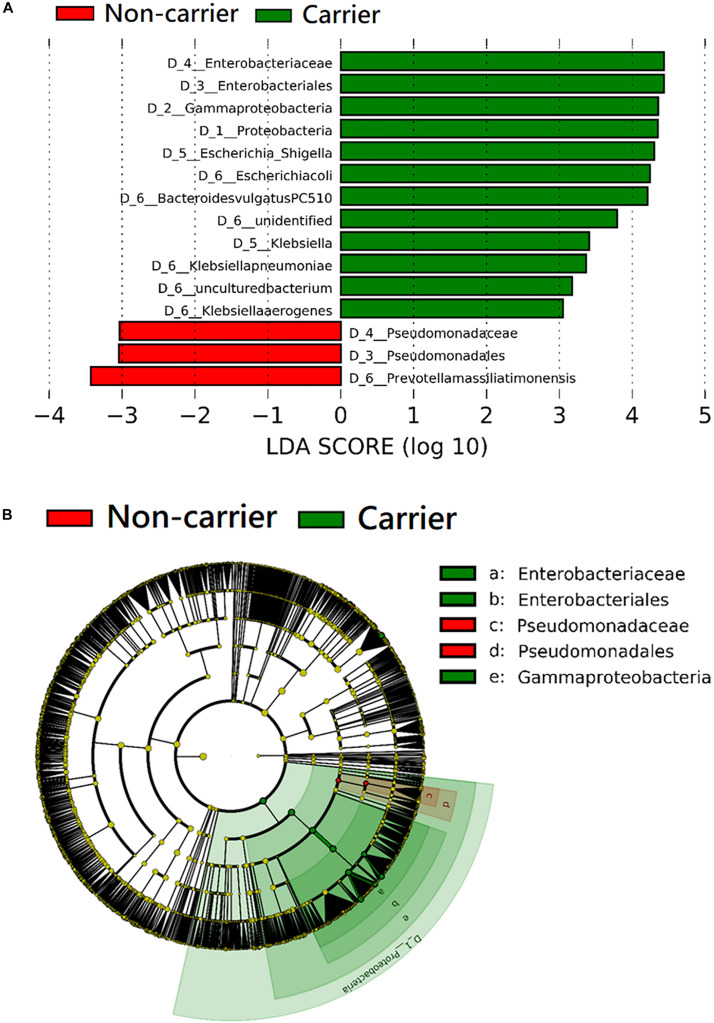
FIGURE 4.
Comparison of the composition of fecal microbiota between third-generation cephalosporin-resistant E. coli or K. pneumoniae carriers (n = 20) and non-carriers (n = 60) by linear discriminant analysis (LDA) effect size (LEfSe). (A) Histogram of the LDA scores shows the most differentially abundant taxa in the two groups. (B) The cladogram shows the significantly overrepresented bacterial taxa in each group.

