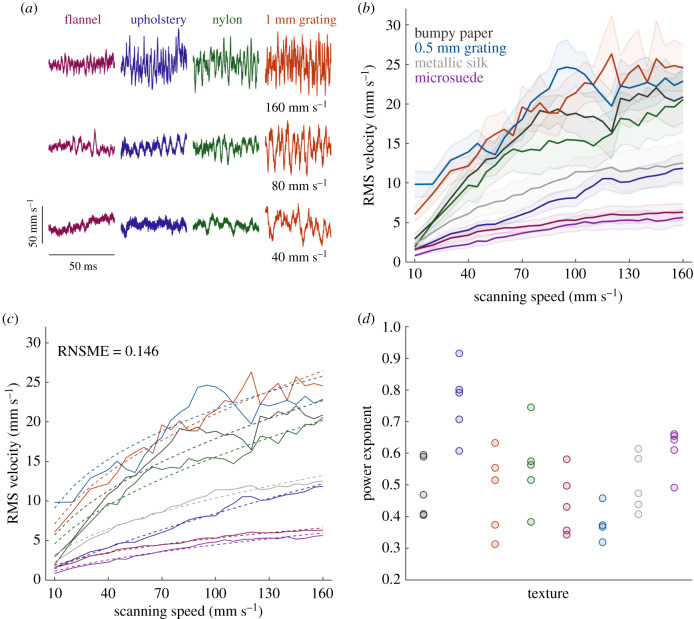
Figure 1.
The RMS velocity of texture-elicited vibrations increases as scanning speed increases. (a) Example velocity traces for four textures scanned at three speeds. (b) RMS velocity elicited by each texture versus speed; solid line and shaded area indicate mean and standard error, respectively. (c) Mean measured RMS velocity (solid line) and the power model prediction (dashed line). Each trace denotes a different texture. (d) Fitted exponents for each texture and participant.

