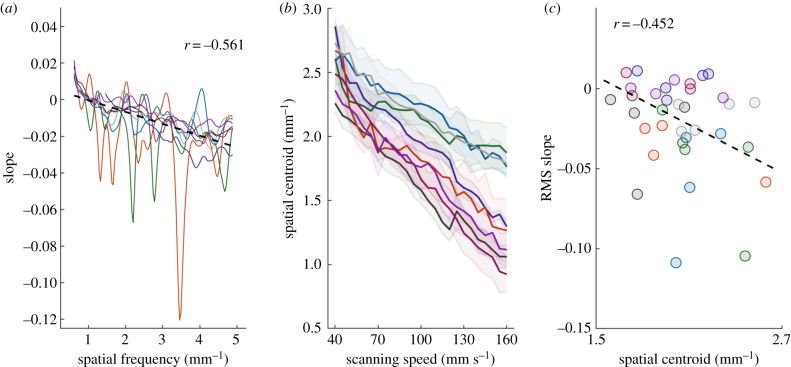
Figure 4.
The amplitude of high-frequency components tends to decrease when scanning speed increases. (a) The ratio between the expected and observed peak power for a PSD is scanning speed dependent. High spatial frequency components decrease in power at a greater rate than do low spatial frequency ones. (b) The centroid of the PSD in spatial units shifts systematically downwards as the speed is increased. (c) The frequency composition of the PSD partly predicts how the RMS displacement will change with speed (spatial centroids are for 90 mm s−1). Color scheme follows that of figure 1; dashed black line in (a,c) represents the line of best fit.

