Figure 1.
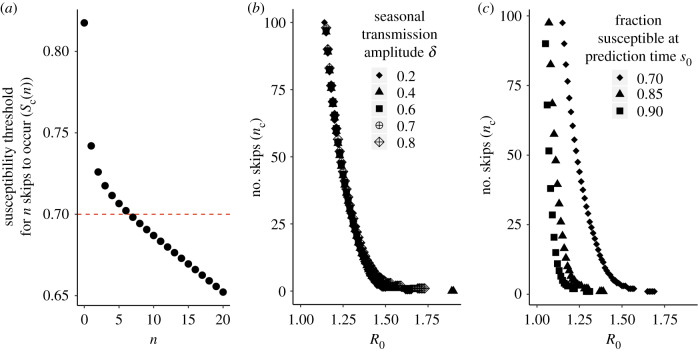
(a) Graphical illustration of how the expected number of skips (nc) is calculated. The black dots represent the threshold fraction of the population susceptible at the time of prediction required for n skips to occur (sc(n)). The plot shows (sc(n)) as a function of n (the number of skips) obtained from equation (2.1) with seasonality amplitude δ = 0.2 (contacts per person per day) and reproductive number R0 = 1.4. In this example, the red line represents the fraction of the population susceptible at the time of prediction (s0). If s0 is smaller than sc(n), at least n skips will occur. To find the expected number of skips (nc), we identify the largest number of skips n such that s0 is smaller than the susceptibility threshold required for those skips sc(n). In this example, the red line intersects the sc(n) curve between sc(n = 6) and sc(n = 7). Therefore, a critical skip number of nc = 6 is obtained. (b,c) The critical skip value nc as a function of R0 for (b) different values of the amplitude of seasonal transmission δ with s0 = 0.7, and (c) different values of the fraction of the population susceptible at the time of prediction (s0) with δ = 0.70. In all three panels, the frequency of transmission ω, the population turnover rate μ and population growth rate r are fixed at respective values ω = (2π/365) d−1 corresponding to an annual periodicity, μ = 1/(74.46 * 365) d−1 corresponding to an average lifespan of approximately 75 years, and r = 1.55 µ d−1 consistent with the growth of the city of Rio de Janeiro. These values were chosen for the purpose of illustration, based on the inverse of the average life expectancy in Brazil in 2012 according to the 2010 census [35], and the interpolation of population estimates for the resident population of the municipality of Rio de Janeiro from the 1991 [36] and 2000 [37] censuses assuming exponential growth.

