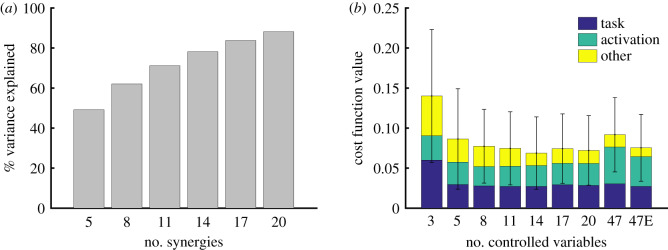
Figure 3.
Synergies and task space performance. (a) Variance in muscle excitations explained versus the number of computed synergies. (b) Average cost (equation (2.1)) for 10 random targets in the plane of figure 1 when the trajectory optimization was performed with increasing control dimensionality. The cost includes weighted terms to represent task performance (blue), effort (green) and other (yellow) criteria such as final hand velocity near 0 and joint limit violations. Error bars represent one standard deviation of the cost function value. We set the same population size and the number of iterations in the optimization for the different controllers, except for 47E where we conducted a more exhaustive search by doubling the population size and the number of iterations.

