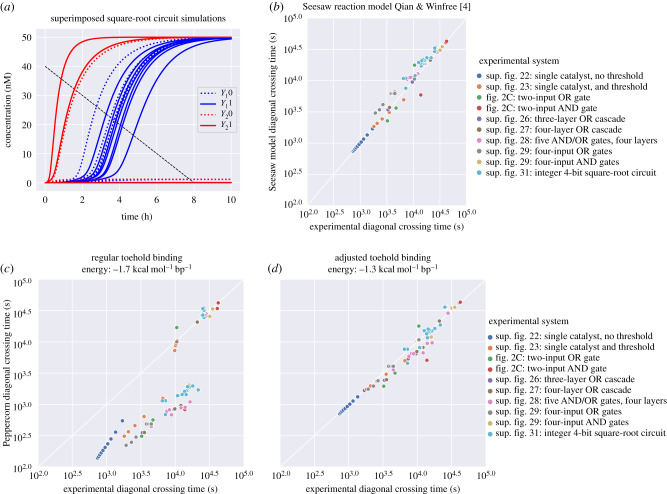
Figure 10.
Enumeration and simulation of DNA strand displacement circuits using the Seesaw architecture [4]. (a) Superimposed simulations of the largest circuit, which computes the floor of the square root of a 4-bit binary number. Y10, Y11, Y20, Y21 represent the dual-rail implementation of the 2-bit binary output. The full trajectory for each of the 16 possible input combinations is shown. The diagonal-crossing time metric used in this and subsequent plots enables us to compare OFF signals, which remain at low concentration and are inherently relevant for dual-rail systems. We choose the endpoints of the diagonal at the maximum clearly visible reference point of experimental data plots (see electronic supplementary material, §2). Enumeration and simulation settings correspond to those explained for (d). (b) Comparison of the Seesaw compiler simulation model with experimental data, both derived from Qian & Winfree [4] and using the diagonal-crossing time metric described above. (c) Comparison of Peppercorn enumeration with the same experimental results using condensed, rate-dependent semantics (kslow = 0.01 s−1, kfast = 1 s−1). Differences between OFF trajectories (comparatively slower) are small, but differences on ON trajectories can be strong, as simulated systems are much faster than the experimental results. (d) Comparison of Peppercorn enumeration with experimental results after the toehold binding free energy has been changed to −1.3 kcal mol−1 bp−1. This slows down ON trajectories sufficiently to provide similar-quality predictions of completion time as the Seesaw compiler itself. Runtime for enumeration (TE) and condensation (TC) on a PC (i5-4300U CPU @ 1.90GHz): For of all systems except square-root circuit: TE = 7.42 s, TE + TC = 19 s. Square-root circuit: TE = 1 min 15 s, TE + TC = 8 min 1 s.

