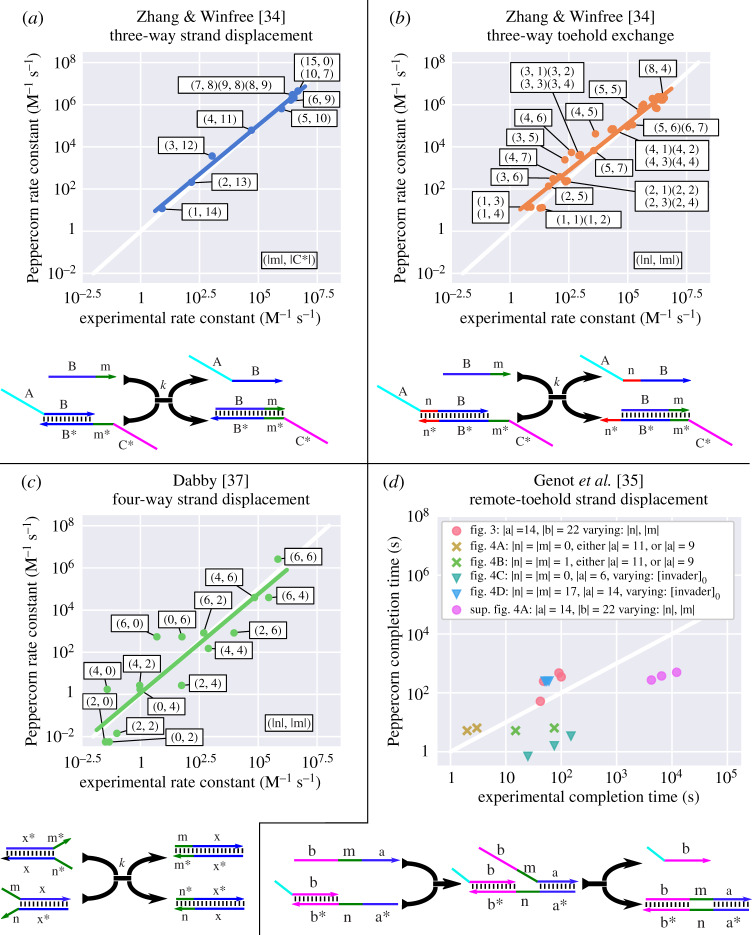
Figure 7.
Comparison of Peppercorn’s condensed reaction rates with experimentally derived reaction rate constants; corresponding drawings below illustrate the design of these investigated systems. (a–c) Plots compare a range of different toehold lengths and branch-migration domain lengths for classic three-way strand displacement [34], three-way toehold exchange [34], and four-way strand displacement [37], respectively. Regression lines show the correspondence of model and experimental data over approximately nine orders of magnitude. An annotation is provided for selected points, corresponding to the lengths of relevant domains in the drawings below. (d) Comparing system completion times for proximal and remote toehold experiments measured by Genot et al. [35] with Peppercorn predictions. Experimental data are taken from six figures in [35] (fig. 3, fig. 4A, fig. 4B, fig. 4C, fig. 4D and sup. fig. 4A). There are three types of experiments (indicated by different marker shapes): fig. 3, sup. fig. 4A [35] (circles) compare remote-toehold three-way strand displacement with variable length of the spacer region between toehold and branch-migration domain, using slightly different experimental set-ups; in fig. 3 [35], a fluorophore/quencher pair is attached directly to the displaced strand, while in sup. fig. 4A [35] a separate reporter reaction occurs. fig. 4A [35] measures kinetics of a 9 or 11 nt proximal toehold (where |n| = |m| = 0), compared to a remote toehold in fig. 4B [35] (where a 1 nt spacer region was introduced; crosses). fig. 4C [35] analyses the sensitivity of proximal 6 nt toehold to different initial concentrations of the invader strand ([invader]0 = 66 nM, 145 nM, 330 nM), compared to a remote setting (fig. 4D [35]), where a 14 nt toehold combined with a 17 nt spacer was used (triangles). Peppercorn’s model confirms the observation that the remote toehold makes the overall reaction rate insensitive to concentration changes; the three data points overlap. Runtime for enumeration (TE) and condensation (TC) on a PC (i5-4300U CPU @ 1.90 GHz): (a,b) TE + TC = 3.86 s, (c) TE + TC = 878 ms, (d) TE + TC = 347 ms.

