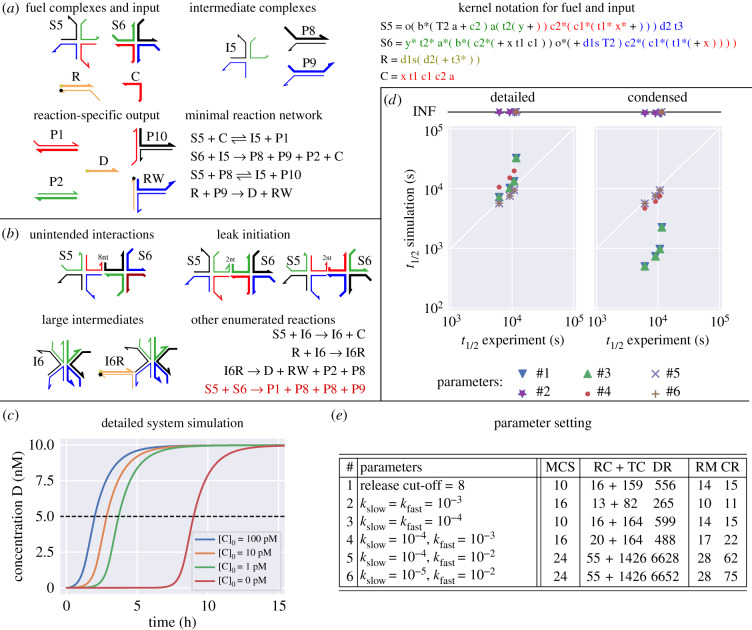
Figure 8.
Autocatalytic DNA strand displacement from Kotani & Hughes [66]. A system with diverse reaction pathways involving three-way, four-way, and remote-toehold branch migration. (a) An overview of the intended system. Six reactions (two reversible, two irreversible) perform autocatalytic amplification of C. The colours of complexes are chosen to indicate which strands of the fuel complexes will eventually hybridize. R is the reporter complex with a fluorophore (yellow star) and quencher (black dot) on one side. The top strand of the reporter is called Dye (D) and used to track the production of catalyst C. Kernel strings using the same colour scheme are shown for all initially present complexes. Despite a difference in colour the unpaired part of P8 has the same sequence as C and thus can act as catalyst. (b) Examples of unintended reactions, large intermediate complexes, and leak reactions. The leak pathway (bottom, red) produces products without presence of the catalyst. (c) A simulation of the experimental setup with initial conditions nM and shows trajectories of the Dye species D for four initial conditions of catalyst C. The system was enumerated using rate-independent semantics (i.e. parameter setting #1 in the table). Colour scheme corresponds to fig. 4 in Kotani & Hughes [66], which shows experimental data. Note that this enumeration semantics includes the leak reaction, triggered without the presence of C. The dashed line marks the threshold to calculate the 50%-completion time for comparison with experimental data. (d) The plot compares 50%-completion times (t1/2) for six different enumeration semantics shown in (e), each with the four initial conditions simulated in (c). Enumeration using setting #2 does not yield the fluorescent product species, settings #4, #5, #6 do not return the leak pathway; the corresponding simulation trajectories (with [C]0 = 0) never reach 50%-completion time (INF). (e) The table gives different enumeration parameters that have been tested: release cut-off, kslow and kfast, and their effects in terms of maximum complex size (MCS), numbers of resting complexes (RC), transient complexes (TC) and detailed reactions (DR) for the detailed CRN and numbers of resting macrostates (RM) and condensed reactions (CR) for the condensed model. Runtime for enumeration (TE) and condensation (TC) on a PC (i5-4300U CPU @ 1.90 GHz): (d) detailed enumeration: TE = 1 min 19 s, (d) condensed enumeration: TE + TC = 1 min 59 s.

