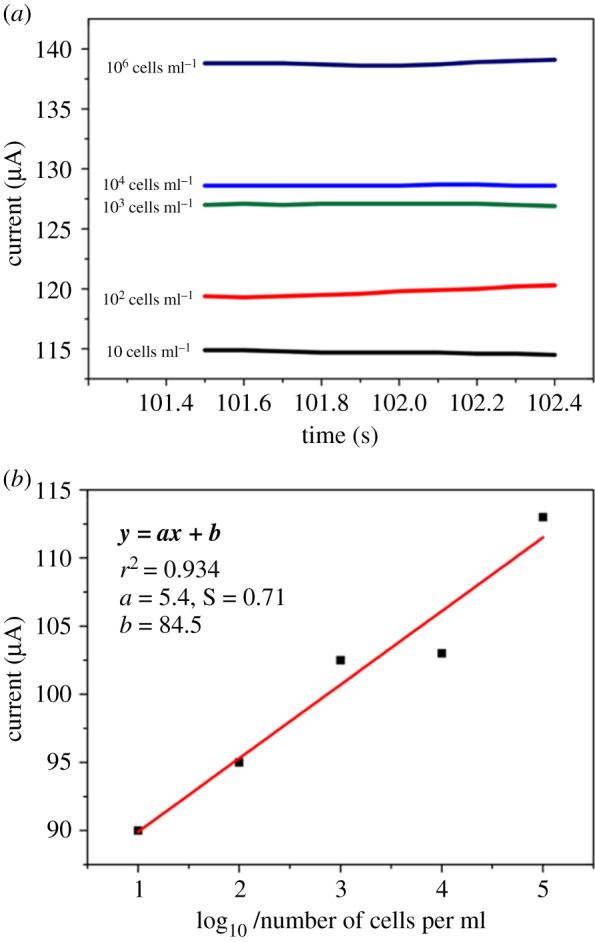
Figure 6.

(a) The direct amperometry responses (current versus time) obtained for breast cancer cells captured at different serial dilution concentrations (10–105 cells ml−1). The responses measured in 1 mM HQ/10 M H2O2. Relative standard deviation of 5.0% (n = 3). The calibration plot in (b) was used to calculate LOD and LOQ values. The slope of the graph, 5.4; the standard error of slope, 0.7; the linear regression (r2), 0.93. We considered the net responses in the LOD and LOQ calculations.
