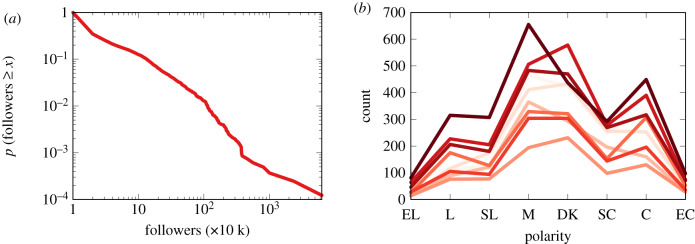
Figure 3.
(a) The cumulative distribution of source popularity on Facebook in our dataset: the probability (y-axis) of a page to have a given number of followers or more (x-axis). (b) The polarity distribution in the USA from 1994 (light) to 2016 (dark). Biannual observation, except for missing years 2006, 2010 and 2014. EL, extremely liberal; L, liberal; SL, slightly liberal; M, moderate; DK, don’t know; SC, slightly conservative; C, conservative; EC, extremely conservative.

