
Figure 4: Differential Changes in Dendritic Spines in Apical Proximal vs Distal Dendritic Segments.
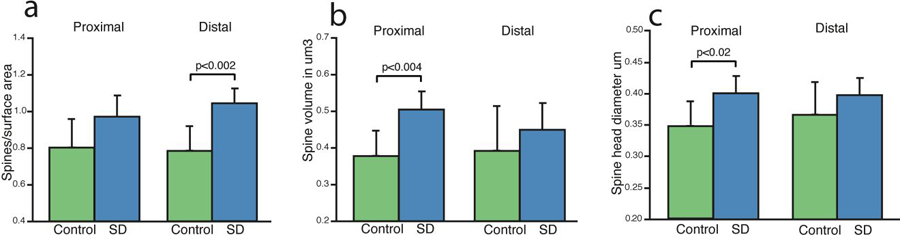
Analysis of dendritic spine measures divided into proximal vs distal branch segments shows greater spine density selective for distal branch segments (a), and selective increases in spine volume (b) and spine head diameter (c) in proximal segments. Data represent an average of 60–80 dendritic segments per animal, 300–400 segments per group. Error bars represent standard deviation.