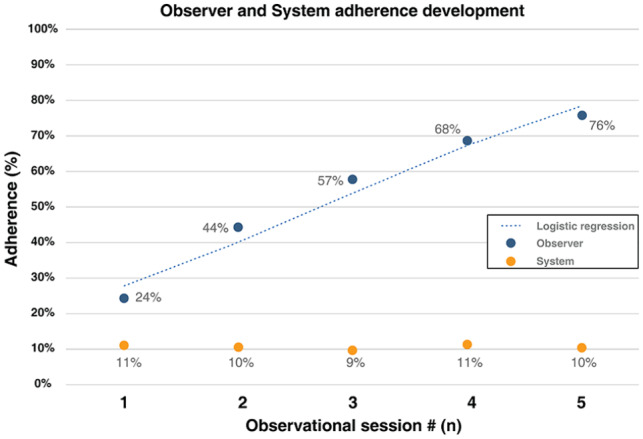
Figure 5.

Showing the average observer and EMS measured adherence. The EMS rates are measured 3 h before the arrival of the observer for each of the observation sessions. It also shows the logistic regression curve.

Showing the average observer and EMS measured adherence. The EMS rates are measured 3 h before the arrival of the observer for each of the observation sessions. It also shows the logistic regression curve.