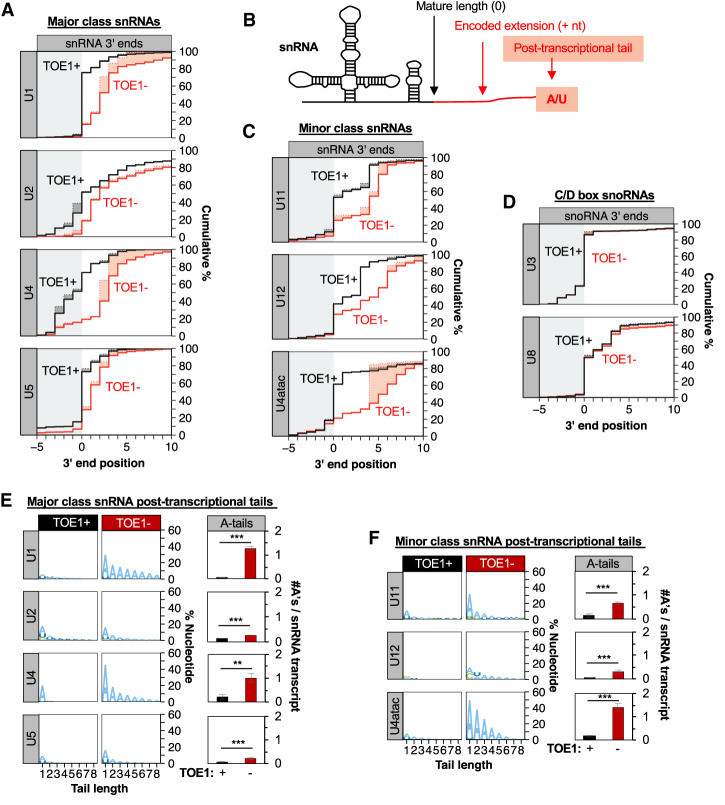
Figure 1.
TOE1 processes RNA polymerase II transcribed snRNAs of the major and minor spliceosome. (A) Cumulative plots of nascent major class snRNA 3′ end positions from degron cells expressing (black line, TOE1+) or depleted for (red line, TOE1−) TOE1. snRNA 3′ ends were identified by RNA sequencing of nascent RNA isolated by metabolic labeling with 5-ethynyl uridine (5-EU) followed by purification using Click-iT technology. Position “0” refers to the mature 3′ end of snRNAs indicated by the border between gray and white backgrounds. Solid lines represent actual 3′ end positions of snRNAs including any posttranscriptional nucleotides, while dotted lines represent the predicted 3′ end of genome-encoded sequences with posttranscriptionally added nucleotides indicated by the shading between the lines. Only reads terminating at or downstream of position −5 are represented. Averages of at least three independent experiments are plotted for each snRNA. (B) Schematic of a U1 snRNA processing intermediate with the mature snRNA portion shown in black, a genome-encoded 3′ extension in red and posttranscriptionally added nucleotides are red with red shading. (C) Cumulative plots of nascent minor class snRNA 3′ end positions ±TOE1 as in A. (D) Cumulative plots of nascent C/D-box snoRNA 3′ end positions ±TOE1 as in A. (E, left) Sequence logo plots representing the percent of major class snRNAs with posttranscriptionally added nucleotides ±TOE1, broken down by nucleotide composition. Tail length refers to the number of posttranscriptional nucleotides added (up to eight shown). (Right) Average number of posttranscriptional adenosines per nascent major snRNA transcript when TOE1 is present (black) or depleted (red). (F) Sequence logo plots for minor class snRNA posttranscriptional nucleotides (left) and average number of posttranscriptional adenosines (right) as in E. Error bars indicate standard error of the mean (SEM) from at least three independent experiments. P-values (Student's two-tailed t-test): (**) P < 0.05; (***) P < 0.01. See also Supplemental Figure S1.

