Figure 3.
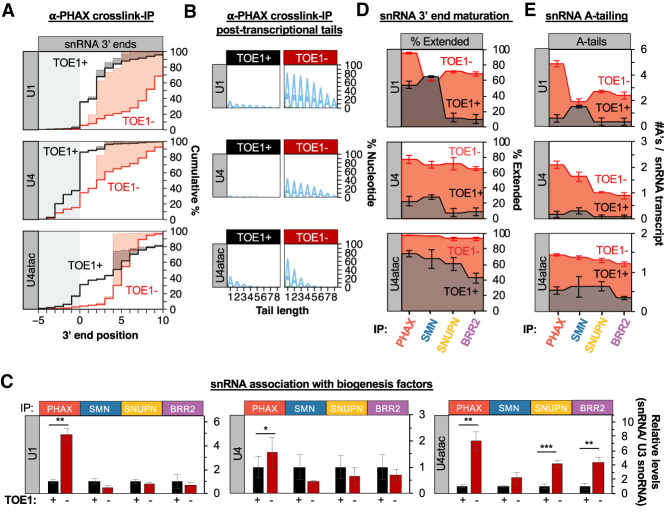
TOE1 depletion causes accumulation of unprocessed adenylated snRNAs with PHAX. (A) Cumulative plots of 3′ end positions of U1, U4, and U4atac snRNAs associated with PHAX in the presence (black) or absence (red) of TOE1, monitored by cross-linking and immunoprecipitation followed by snRNA 3′ end sequencing. (B) Sequence logo plots representing the percent of U1, U4, and U4atac snRNAs associated with PHAX that have posttranscriptional added nucleotides ±TOE1, broken down by nucleotide composition. (C) Relative levels of U1, U4, and U4atac snRNAs associated with biogenesis factors when TOE1 is present (black) or depleted (red) as measured by RT-qPCR assays normalized to the TOE1 nontarget control U3 snoRNA, with averages of normalized U1, U4, and U4atac snRNA levels when TOE1 is present set to 1. Error bars indicate SEM from three independent experiments. P-values (Student's two-tailed t-test): (*) P < 0.1; (**) P < 0.05; (***) P < 0.01. (D) Step plots showing the percentage of biogenesis factor-associated U1, U4, and U4atac snRNAs that are 3′ end extended in the presence (black) or absence (red) of TOE1 as monitored by cross-linking/immunoprecipitation and 3′ end sequencing. The average of three experiments is represented and SEM is represented by error bars. (E) Step plots representing the average number of posttranscriptional adenosines per snRNA transcript associated with snRNA biogenesis factors when TOE1 is present (black) or depleted (red). The average of three experiments is represented and SEM is represented by error bars. See also Supplemental Figure S3.

