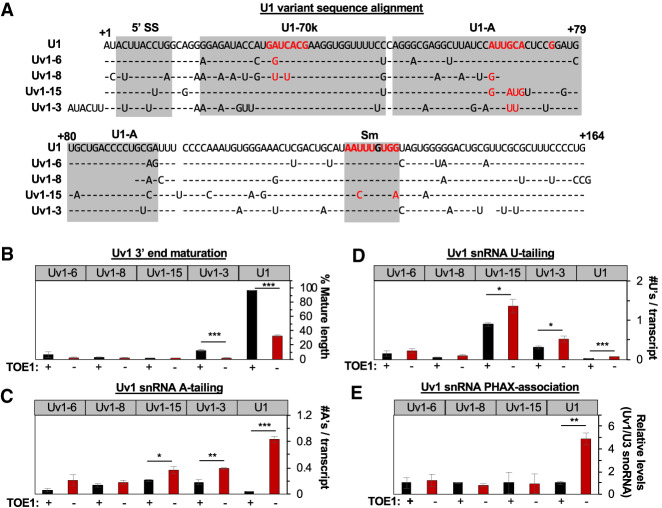
Figure 5.
TOE1 selectively processes regular U1 snRNA over U1 snRNA variants. (A) Sequence alignment of U1 variant snRNAs with regular U1 snRNA based on O'Reilly et al. (2013). Gray boxes indicate RNA or protein interaction interfaces with critical protein-binding nucleotides highlighted in red (Kondo et al. 2015). (B) Percentage of mature length U1 variant snRNAs as monitored by 3′ end sequencing of RNA harvested at steady state when TOE1 is present (black) or depleted (red). (C) Average number of adenosines added per U1 variant snRNA transcript as monitored by 3′ end sequencing ±TOE1. (D) Average number of uridines added per U1 variant snRNA transcript as monitored by 3′ end sequencing ±TOE1. (E) Relative levels of association of U1 variants with PHAX when TOE1 is present (black) or depleted (red) as measured by RT-qPCR assays normalized to the TOE1 nontarget control U3 snoRNA, with averages of normalized U1 variant snRNA levels when TOE1 is present set to 1. Error bars indicate SEM from three independent experiments. P-values (Student's two-tailed t-test): (*) P < 0.1; (**) P < 0.05; (***) P < 0.01. See also Supplemental Figure S5.

