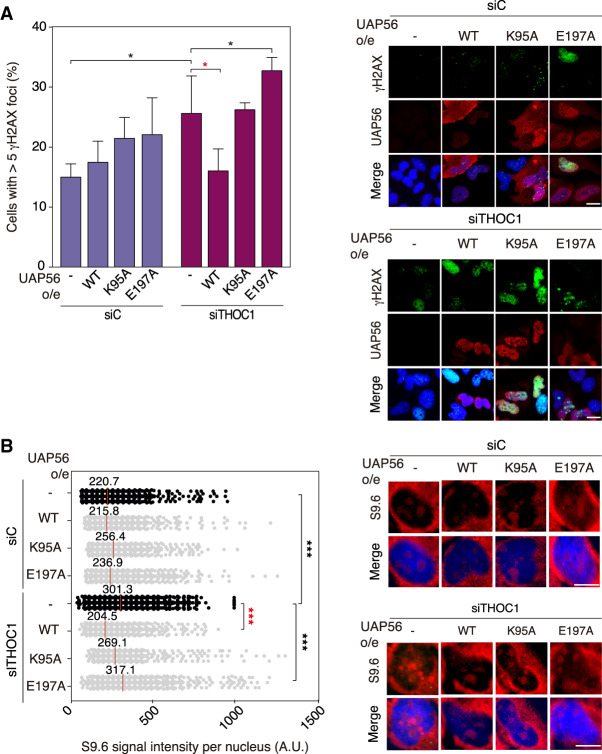
Figure 5.
UAP56 overexpression rescues R-loop and R-loop-mediated genome instability in a helicase-dependent manner. (A) Representative images and detection of γH2AX foci by IF in siC and siTHOC1 HeLa cells transfected with pFlag (−UAP56), pFlag-UAP56 (+UAP56) for UAP56 overexpression, and with pFlag-UAP56-K95A (+UAP56-K95A) and pFlag-UAP56-E197A (+UAP56-E197A) for helicase-dead UAP56 overexpression. Other details as in Figure 4A. More than 70 cells per condition were considered in each experiment. Data are plotted as mean + SEM (n = 4). Scale bar, 25 μm. (*) P < 0.05, Student's t-test, two-tailed. (B) Representative images and quantification of S9.6 immunofluorescence signal siC and siTHOC1 HeLa cells transfected with pFlag (−UAP56), pFlag-UAP56 (+UAP56) for UAP56 overexpression, pFlag-UAP56-K95A (+UAP56-K95A) and pFlag-UAP56-E197A (+UAP56-E197A) for helicase-dead UAP56 overexpression. More than 100 cells per condition were counted in each experiment. The graph shows the median of the S9.6 signal intensity per nucleus (n ≥ 3). Other details as in Figure 4B. Scale bar, 10 μm. (***) P < 0.001, Mann-Whitney U-test, two-tailed. Data information: Black stars denote significant increases, whereas red stars denote significant decreases.

