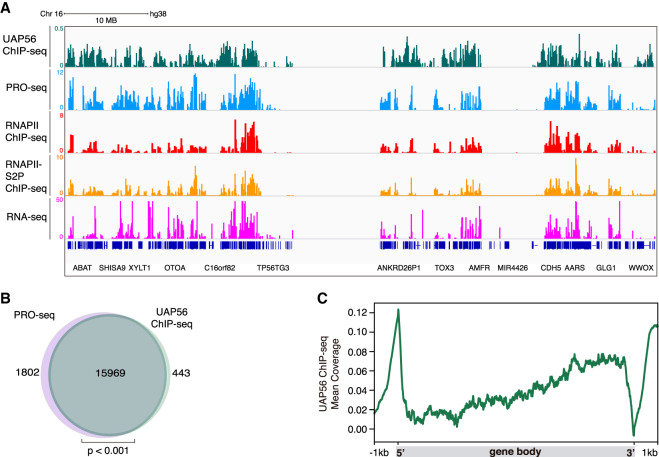
Figure 6.
Genome-wide chromatin-associated action of UAP56. (A) Representative screenshot of a genomic region in which UAP56 ChIP-seq (green), PRO-seq (light blue), RNAPII ChIP-seq (red), RNAPII-S5P ChIP-seq (orange), and RNA-seq (magenta) in K562 cells is shown. (B) Venn diagram showing the overlap between protein-coding genes transcribed in K562 cells detected by PRO-seq (light purple) and UAP56 chromatin-bound protein-coding genes detected by ChIP-seq (green). P < 0.001, hypergeometric test. (C) Metaplot analysis of the distribution of the UAP56 ChIP-seq signal (IP-Input) along a model gene body.

