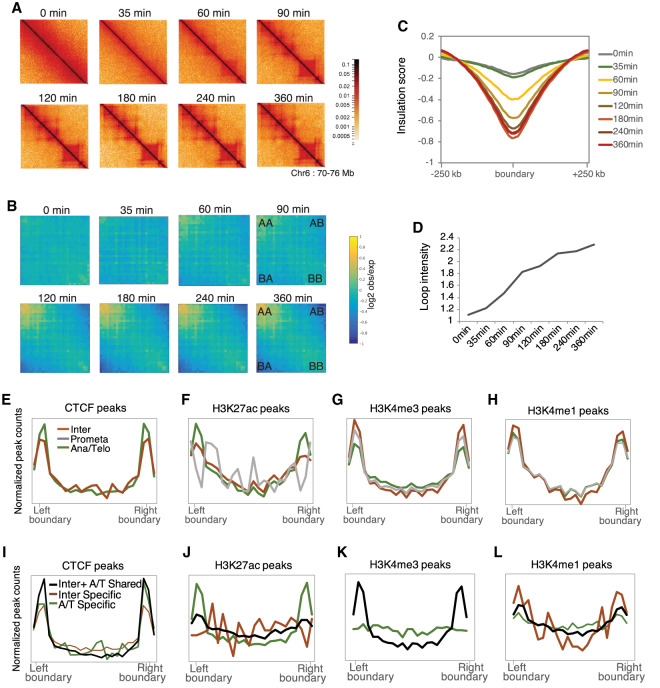
Figure 6.
Long-range chromatin interactions are reformed between 90 and 120 min after release from mitotic arrest. (A) Hi-C contact maps of chromosome 6: 70,000,000–76,000,000 showing TADs for each time point. (B) Saddle plots showing global A-A, B-B, and A-B compartment signals for each time point. A/B compartment score derived from first principle components were sorted and divided into 30 quantiles. Saddle plots show the average observed/expected interaction frequency between regions according to the eigen vector values of both ends. (C) Average insulation score near TAD boundaries for each time point. (D) Average DNA loop intensity for each time point. Loop annotations were firstly identified for the 360-min time point using hiccups. The loop intensity is the average observed/expected interaction frequency. (E–H) ChIP-seq signals of CTCF (E), H3K27ac (F), H3K4me3 (G), and H3K4me1 (H) in interphase (orange), prometaphase (gray), and anaphase/telophase (green) at TAD boundary regions. (I–L) Interphase and anaphase/telophase peaks were categorized into either interphase-specific (Inter Specific, orange), anaphase/telophase-specific (A/T Specific, green), or shared between interphase and anaphase/telophase (Inter + A/T Shared, black). CTCF (I), H3K27ac (J), H3K4me3 (K), and H3K4me1 (L) peaks in each category were aligned at TAD boundary regions. In K, there were no H3K4me3 interphase-specific peaks that were observed at TAD boundary regions.

