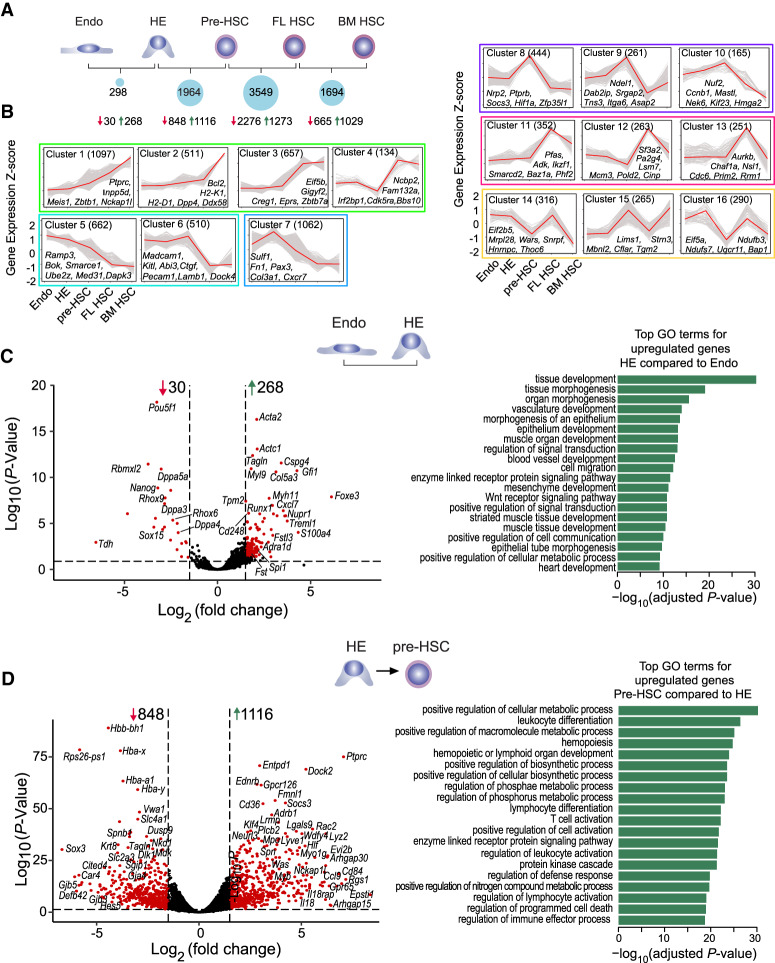
Figure 2.
Transcriptome dynamics during HSC ontogeny. (A) Number of DEGs between adjacent developmental stages with corresponding down-regulated (red arrow) and up-regulated genes (green arrow) shown below. Some DEGs in pairwise stage comparison overlap. DEGs were identified using FDR < 0.01 and fold change ≥ 2 (ANOVA, multiple-testing corrected P-value < 0.01). (B) Sixteen expression clusters during HSC ontogeny. Expression profiles were clustered using the STEM algorithm and all 5025 DEGs among all stages. Y-axis values are gene-wise Z-score of FPKM values. X-axis and Y-axis values are indicated in the bottom left graph. For each cluster, the numbers of genes are shown in parentheses. The 16 clusters are further organized into six color-coded groups based on their overall expression profiles. Group 1 (clusters 1–4) in are boxed in green, group 2 (clusters 5–6) in cyan, group 3 (cluster 7) in blue, group 4 (clusters 8–10) in purple, group 5 (clusters 11–13) in magenta, and group 6 (clusters 14–16) in yellow. Example genes for each cluster are also shown. (C, left) Volcano plot of DEGs between Endo and HE stage; selected genes are listed. (Right) The top GO terms for genes up-regulated in HE relative to Endo. (D) Same as in C, for differences between HE and pre-HSC stages.

