Figure 3.
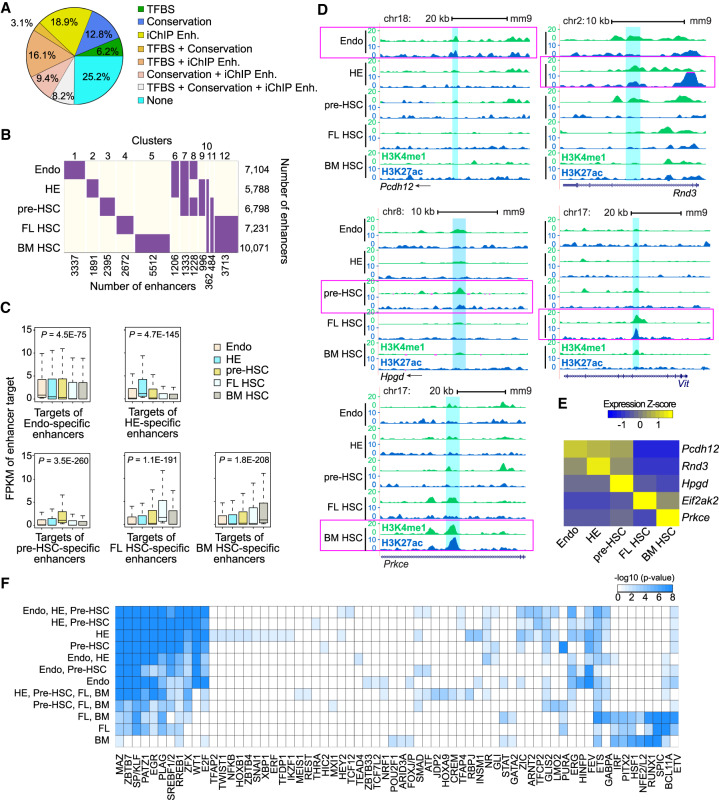
Repertoire of active enhancers during HSC ontogeny. (A) Supporting evidence for predicted enhancers. TFBS, transcription factor binding peaks from ChIP-seq data (Wilson et al. 2010); Conservation, conserved sequence across 20 mammalian genomes; iChIP Enh, enhancers from (Lara-Astiaso et al. 2014). (B) Clustering of enhancer activity profile across five developmental stages. (Purple) Active enhancers; (ivory) inactive enhancers. Numbers of enhancers in each cell type/cluster are shown. Only enhancers that are present in significant clusters are counted. (C) Box plots of expression profile of target genes of stage-specific enhancers. P-values, differential expression between stage-specific enhancer targets and targets of the rest of the enhancers using t-test. (D) Genome browser view of example developmental stage-specific enhancers (2-kb region highlighted in cyan) in Endo, HE, pre-HSC, FL HSC, and BM HSC. Magenta horizontal boxes highlight tracks for each cell population. (E) Target gene expression patterns of developmental stage-specific enhancers in D. (F) TFs whose DNA-binding motifs are enriched in stage-specific enhancers. Stage specificities are indicated at the left of each column. (BM) BM HSC; (FL) FL HSC. Color shade is proportional to the negative logarithm of enrichment P-value.

