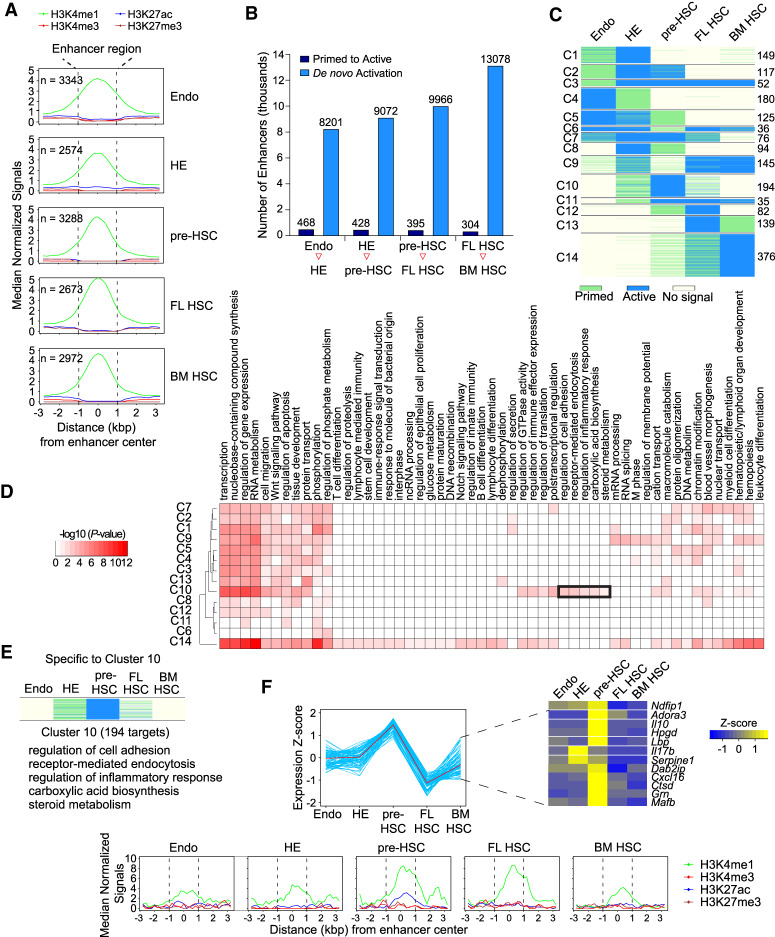
Figure 4.
Primed enhancers during HSC ontogeny. (A) Metagene plot of normalized histone mark ChIP-seq signals at predicted primed enhancers (n indicates total number of primed enhancers identified in each stage) (B) Dynamics of primed and de novo activated enhancers during HSC ontogeny between each adjacent stage. (C) Clustering based on the activation pattern of the primed enhancers during HSC ontogeny. Cluster number is at the left and the number of enhancers within each cluster is at the right. (D) Enriched GO terms of genes targeted by primed enhancers within each cluster. A black rectangle highlights C10-specific GO terms specific for pre-HSCs. (E) Enhancer signal profile and enriched GO terms of predicted target genes of enhancers in cluster 10. (F, top) Expression of inflammatory response genes in cluster 10. (Bottom) Metagene plot of normalized histone mark ChIP-seq signals at primed enhancers targeting the inflammatory response genes in cluster 10.

