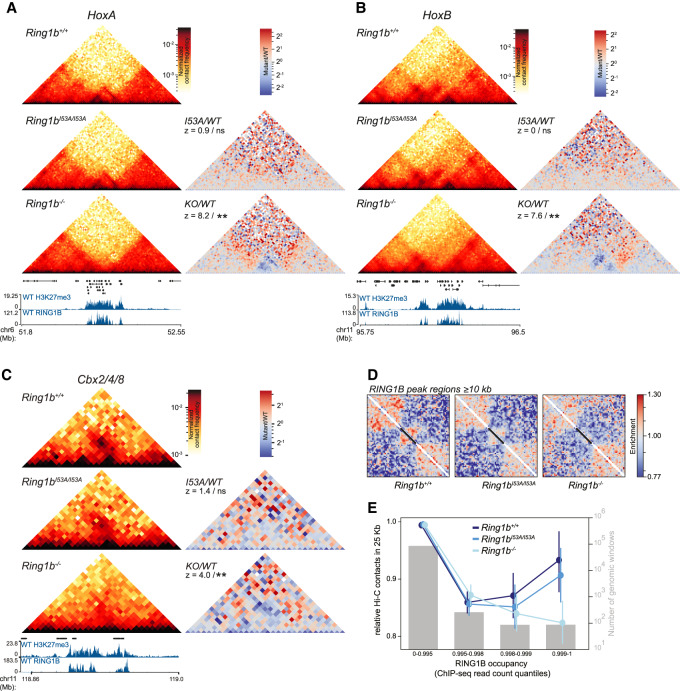
Figure 3.
Local compaction of PRC1 targets. (A) Hi-C maps of the HoxA cluster from Ring1b+/+, Ring1bI53A/I53A, and Ring1b−/− mESCs at 10-kb resolution. Ratios of maps from mutant over wild-type cells also shown at the right together with statistical estimation (z-score and significance level; [ns] P > 0.05; [**] P ≤ 0.01) of the difference in contact frequency within the HoxA cluster (statistical estimation performed on chr6 52.1- to 52.22-Mb mm9 genome build) between the cell lines. Genes, H3K27me3 and RING1B ChIP-seq profiles are shown below. (B) Same as A, but for HoxB (statistical estimation performed on chr11 96.11–96.22 Mb). (C) As in A, but for Cbx2/4/8 (statistical estimation performed on chr11 118.88–118.96 Mb; mm9 genome build). (D) Rescaled observed/expected pileups of all RING1B peak regions ≥10 kb in length (n = 181) in Ring1b+/+, Ring1bI53A/I53A, and Ring1b−/− cells. Black bars represent the location of the RING1B peak regions in the averaged map. (E) Average (±95% confidence interval) level of observed/expected contacts within 25-kb genomic windows split by percentiles of wild-type RING1B ChIP-seq signal shown for each of Ring1b+/+, Ring1bI53A/I53A, and Ring1b−/− mESCs. Gray bars show number of windows in each category (right Y-axis).

