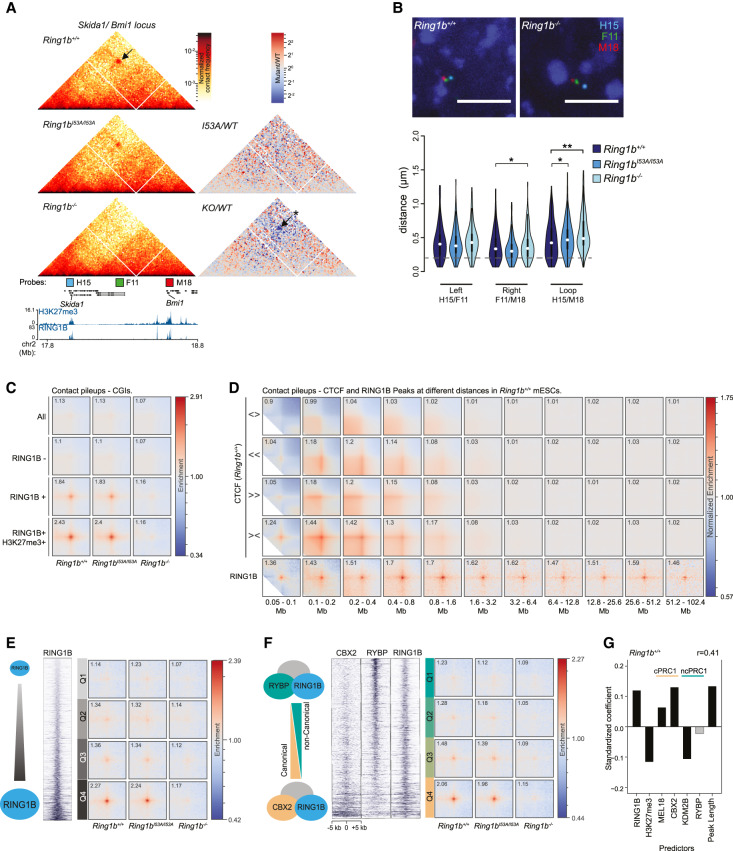
Figure 4.
Characterization of distal interactions between PRC1 targets. (A) Hi-C data for the region of chromosome 2 harboring the Skida1 and Bmi1 polycomb targets. Data presented as for Figure 3A. Distal interactions are highlighted with arrows and the significance of differntial signal between Ring1b+/+ and Ring1b−/− Hi-C data is indicated. (*) P ≤ 0.05 and P > 0.01. Also shown are the locations of FISH probes for the PcG+ Skida1 (H15) and Bmi1 (M18) loci and an intervening PcG− site (F11). (B) Representative images of 3D FISH from Ring1b+/+ and Ring1b−/− cells with probes shown in A. (Below) Violin plots show the interprobe distances (µm) for probe pairs shown in A in Ring1b+/+, Ring1bI53A/I53A, and Ring1b−/− cells. (*) P ≤ 0.05 and P > 0.01; (**) P ≤ 0.01; Mann Whitney test. Probes separated by <0.2 μm (dashed gray line) are considered to be colocalized. (C) Pileups of interactions between CGIs. In rows: all CGIs, RING1B-negative CGIs, RING1B-positive CGIs, and RING1B/H3K27me3-double-positive CGIs. In columns: Ring1b+/+, Ring1bI53A/I53A, and Ring1b−/− cells. (D) Pileups of interactions between CTCF sites and RING1B peaks at different distance separations for Ring1b+/+ cells. In rows: divergent CTCF sites, left-facing CTCF sites, right-facing CTCF sites, convergent CTCF sites, and RING1B peaks. In columns: twofold increasing distance separation ranges from 0.05–0.1 Mb to 51.2–102.4 Mb. (E) Pileups for RING1B peaks with different level of RING1B binding by ChIP-seq. In rows: four quartiles of RING1B occupancy. In columns: Ring1b+/+, Ring1bI53A/I53A, and Ring1b−/− cells. (F) Same as E, but for quartiles of CBX2/RYBP ratio instead of RING1B occupancy. (G) Linear model coefficients for prediction of loop ability of RING1B peaks for Ring1b+/+ cells based on properties of RING1B peak regions (X-axis). Positive values indicate positive impact on loopability. Light gray bars are not significant. P-value > 0.05. Pearson's correlation coefficient of predicted versus observed values is shown at the top right. Predictors associated with canonical and noncanonical PRC1 are denoted by “c” and “nc,” respectively.

