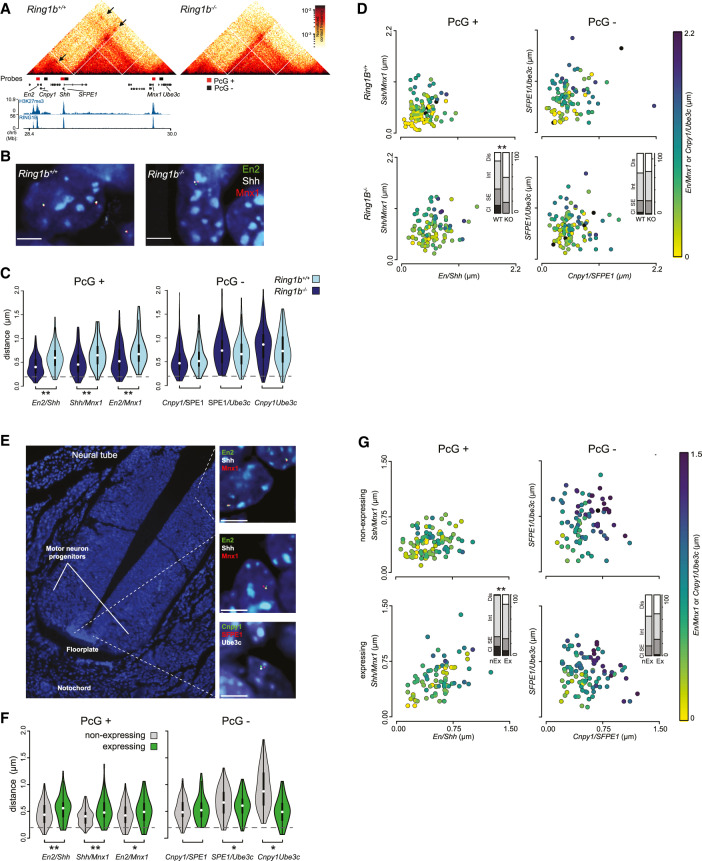
Figure 5.
PRC1 mediates mltivalent interactions in vitro and in vivo. (A) Hi-C heat maps illustrating PRC1-mediated distal interactions within the En2/Shh/Mnx1 locus (presented as for Fig. 3A; loops are highlighted with arrows). Also shown are the locations of the FISH probes used to generate B–G. (B) Representative 3D FISH images of Ring1b+/+ and Ring1b−/− mESCs hybridized with the fosmid probes shown in A targeted to RING1B-positive and -negative sites within the locus (as illustrated in A; red and green bars, respectively). Scale bar, 5 μm. (C) Violin plots depicting the distribution of interprobe distances between each pair of fosmid probes in Ring1b+/+ and Ring1b−/− mESCs. The significance of a shift in the distance between a given pair of probes between different cell lines is indicated. (**) P ≤ 0.01; Mann Whitney test. Probes separated by <0.2 μm (dashed gray line) are considered to be colocalized. (D) Scatter plots depicting the interprobe distances between each of the two fosmid probe pairs with the separation between the third pair indicated by the color in the color bar. Bar plots representing a categorical analysis of three-way clustering (inset) show the percentage of nuclei that show a clustered (Cl), single-excluded (SE), intermediate (Int), or dispersed (Dis) FISH signal. A significant shift in clustering is indicated. (**) P ≤ 0.01; χ2 test). (E) A 3D FISH image of a transverse section through the mouse neural tube at E10.5 with zoomed inset images of 3D FISH for the fosmid probes shown in A. (F,G) 3D FISH data presented as for C and D but for the Shh-expressing (floorplate) and -nonexpressing (dorsal neural tube) cell types indicated in E.

