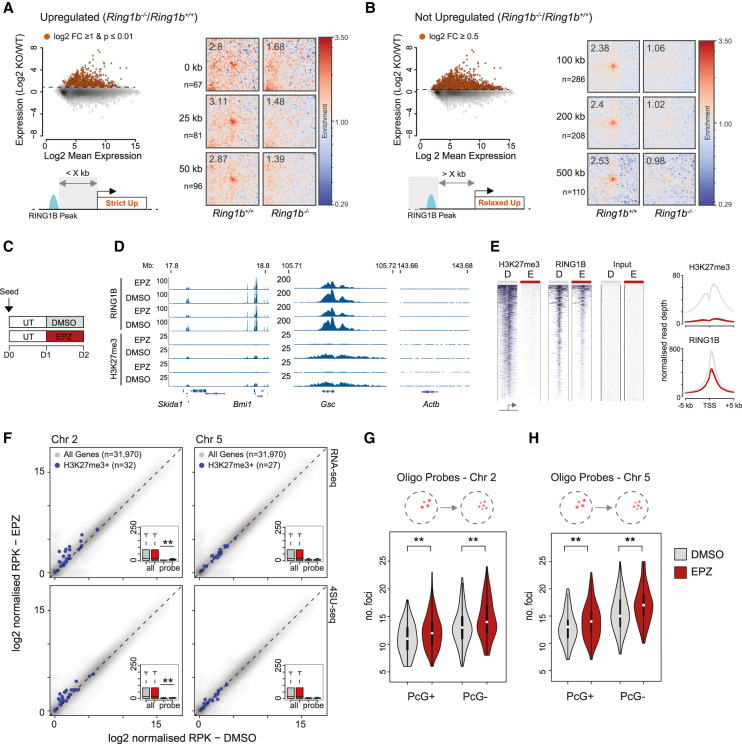
Figure 6.
Relationship between gene up-regulation and loss of PRC1-mediated looping. (A) Criteria on which RING1B peaks were classified as being “up-regulated” in Ring1B−/− versus Ring1B+/+ mESCs. (Top left panel) Scatter plots show the log2 mean gene expression versus log2 gene expression ratio between the two mESC lines. Red points correspond to up-regulated genes with their selection parameters noted above. (Bottom left panel) Cartoon schematic shows how proximity to up-regulated genes (Strict Up) was used to classify RING1B peaks for subsequent Hi-C analysis. (Right panel) Pileup analysis of Hi-C data illustrating PRC1 dependent distal interactions between RING1B peaks located within the indicated distance from an up-regulated gene in Ring1B+/+ and Ring1B−/− mESCs. (n) Number of RING1B peaks used in each row. (B) As for A but representing those RING1B peaks that are distant from up-regulated genes (distant to “Relaxed Up” genes). (C) Scheme of EPZ6438 treatment of wild-type mESCs. (UT) serum + LIF; (DMSO) serum + LIF + DMSO; (EPZ) serum + LIF + 2.5 µM EPZ6438. (D) Example browser track views of RING1B and calibrated H3K27me3 ChIP-seq data from mESCs following 24 h of EPZ/DMSO treatment (two independent replicates shown). (E) Heat map representation (left panel) and summary metaplots (right panel) of RING1B and H3K27me3 ChIP-seq signal distribution at RefSeq gene TSS (±5 kb; enriched for their respective marks in wild-type ESCs) in EPZ/DMSO-treated mESCs. (F) Scatter plots showing the relative expression (RNA-seq; top panel) or transcription (4SU-seq; bottom panel) levels between mESCs treated with DMSO and EPZ for 24 h. Genes positive for H3K27me3 and located within the region covered by the oligonucleotide probes on chromosomes 2 and 5 (±100 kb; left and right plots, respectively) are highlighted in blue. Inset box plots summarize these values for “all” and “probe”-associated H3K27me3 positive genes in the two conditions. The significance of differential expression/transcription for genes associated with the two probes was tested using a paired Wilcoxon rank sum tests and the results indicated. (**) P ≤ 0.01. The number of genes representing each set are indicated in parenthesis. (G,H) Violin plots depicting the number of discrete fluorescent foci in DMSO (gray) and EPZ (red), treated mESC hybridized with either the PcG+ or PcG− oligonucleotide probes on chromosomes 2 (G) and 5 (H). The significance of a shift in the number of discrete foci between a given pair of samples was tested using a Mann Whitney test, the results of which are indicated. (**) P ≤ 0.01.

